Gold Price Chart Over Past 10 Years: Historical Trends and Key Market Events

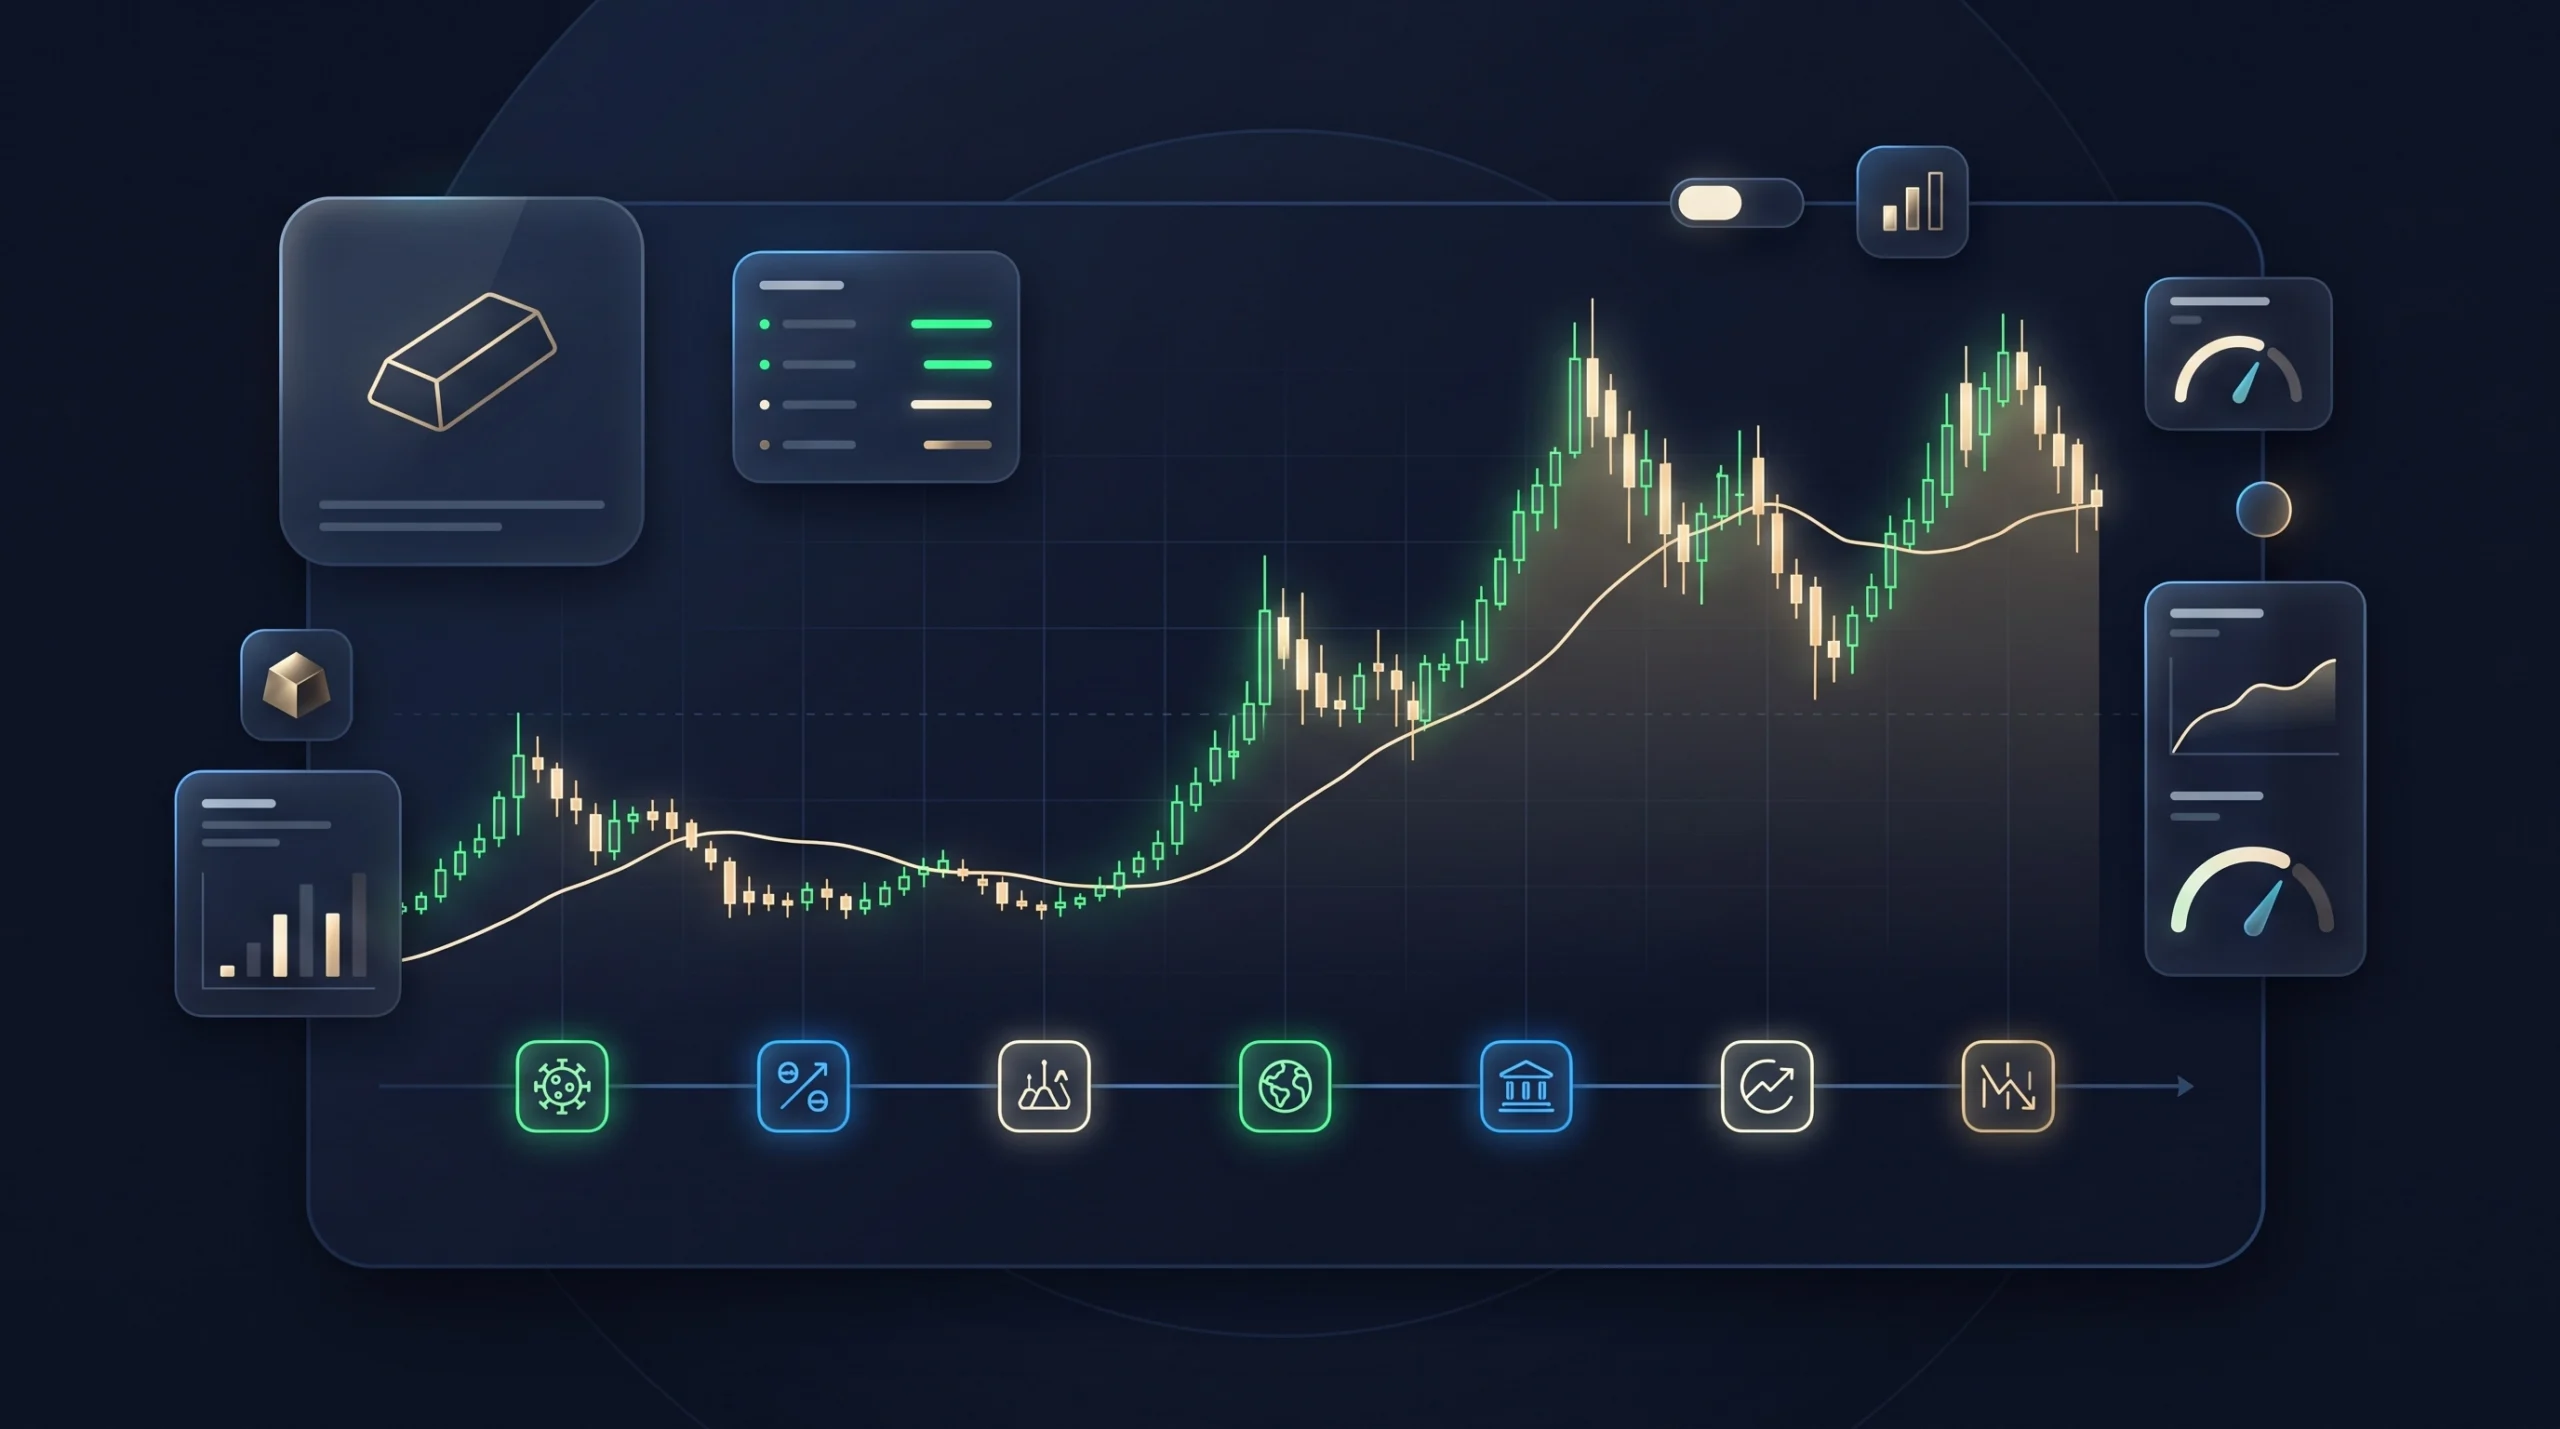
The market moved through several distinct regimes between 2016 and 2026: post-crisis consolidation, trade-war demand, pandemic disruption, aggressive interest-rate tightening, central-bank accumulation, and repeated record highs. Across the last 10 years, a historical chart helps you see how those forces interacted instead of treating every price jump as an isolated event.
This review focuses on USD per troy ounce, the standard global reference. It is educational rather than personalized investment advice. Past performance may provide context, but it does not guarantee future results, especially in a market shaped by leverage, liquidity, exchange rates, and rapidly changing expectations.
Gold Price Chart Over Past 10 Years
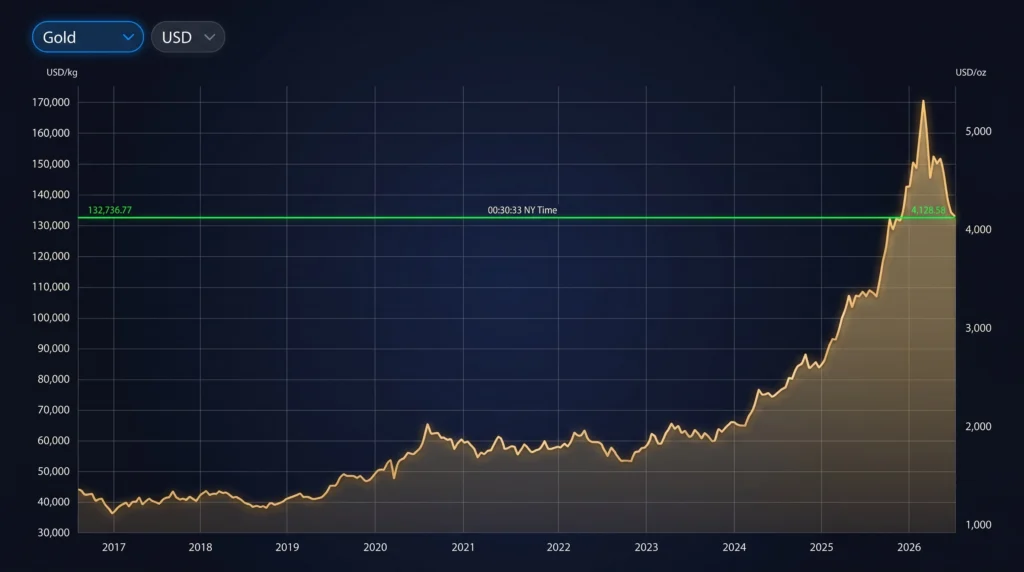
A decade view shows a broad long-term uptrend interrupted by meaningful corrections. The metal traded near the low-$1,100s during parts of 2016, moved above $2,000 during the pandemic, accelerated through 2024 and 2025, and then experienced exceptional volatility in 2026. Scale of that move makes starting date, benchmark, and inflation adjustment especially important.
Gold Price Performance in USD per Ounce
USD pricing lets investors compare one troy ounce across time using a common unit. It also creates a direct relationship with U.S. dollar: when dollar strengthens, buyers using other currencies often face higher local costs, while dollar-denominated metal may come under pressure. That inverse relationship is common, but it is not automatic during crises.
Annual Gold Prices From 2016 to 2026
Rounded annual averages show how gradually rising prices turned into a much faster revaluation after 2023. Figures can differ slightly by benchmark, fixing time, and data vendor. 2026 entry is not a full-year average; it highlights first-quarter and mid-year benchmark levels. (ycharts.com)
| Year | Approximate USD Price per Ounce | Main Market Character |
| 2016 | $1,251 average | Rate uncertainty, post-2015 rebound |
| 2017 | $1,257 average | Steady growth, moderate volatility |
| 2018 | $1,268 average | Strong dollar, late-year recovery |
| 2019 | $1,393 average | Trade war, easing expectations |
| 2020 | $1,770 average | Pandemic shock, emergency stimulus |
| 2021 | $1,799 average | Inflation debate, consolidation |
| 2022 | About $1,800 average | Rate hikes, war, dollar strength |
| 2023 | About $1,940 average | Banking stress, central-bank demand |
| 2024 | $2,386 average | Breakout and repeated records |
| 2025 | $3,431 average | Strong investment flows and record highs |
| 2026 | $4,873 Q1 average; $4,026 June close | January peak, sharp correction |
Nominal Gold Prices Versus Inflation-Adjusted Prices
Nominal prices show what the asset cost at the time. Inflation-adjusted prices estimate purchasing power in today’s money. This distinction matters because a new nominal record does not always exceed every previous peak in real terms. When comparing decades, adjusting for inflation prevents general currency depreciation from being mistaken for pure asset outperformance.
Gold Price Growth Across Full Decade
Using broad decade endpoints, the metal gained substantial value from 2016 levels even after 2026 pullback. Path was not smooth: several multi-month pauses tested investors who assumed a bull market must rise continuously. Long-term price analysis is therefore more useful when it considers drawdowns, recovery time, and volatility, not only percentage gain.
How to Read 10-Year Gold Price Chart
Start with timeframe and unit, then identify major peaks, troughs, and breakout zones. Compare those dates with inflation releases, central-bank decisions, bond yields, dollar direction, and geopolitical events. Readers new to spot and derivative markets may benefit from how to trade gold for beginners before interpreting short-term chart signals as trade setups.
Data Sources and Price Calculation Methods
A spot price, futures settlement, and LBMA benchmark can show slightly different values on same day. Daily closes also depend on timezone. For consistent analysis, use one source and one methodology throughout. Reliable price data should also state benchmark, timezone, and whether figures are closes or intraday quotes.
Earlier historical charts require extra care because its official value was once fixed under monetary systems, including $20.67 per ounce in an earlier U.S. framework and $35 under the Bretton Woods Agreement.
Gold Price Trends From 2016 to 2026
Decade is best read as a sequence of regimes. Each period had a different dominant catalyst, while recurring forces—real yields, dollar direction, risk appetite, and investment flows—continued to interact beneath headlines.
2016–2018: Rate Uncertainty and Dollar Pressure
The metal rebounded in 2016 as investors questioned pace of U.S. tightening and reacted to political uncertainty. Momentum became less consistent in 2017 and 2018. A stronger dollar and rising yields created downward pressure on prices, although late-2018 risk aversion helped establish a base for next major advance.
2019: Trade Tensions and Renewed Safe-Haven Demand
U.S.–China trade war, weaker manufacturing signals, and expectations of easier monetary policy supported renewed demand in 2019. The market broke out of a prolonged range as markets began pricing slower growth and lower interest rates. This phase showed how economic and geopolitical concerns can reinforce each other instead of acting as separate drivers.
2020: Pandemic Peak and Record-Breaking Rally
COVID-19 triggered a flight to safety, disrupted normal market functioning, and prompted large-scale fiscal and monetary support. Unlike the global financial crisis, this shock combined a health emergency with simultaneous supply and demand disruption.
The metal reached a record high above $2,000 during 2020 as real yields fell and investors sought diversification. Rally also included sharp daily reversals, demonstrating that a safe haven asset can remain highly volatile during forced liquidation and profit-taking.
2021–2022: Inflation Surge and Geopolitical Shift
The market consolidated in 2021 while markets debated whether inflation would persist. In 2022, Russia’s invasion of Ukraine initially lifted defensive demand, but aggressive Federal Reserve tightening and a stronger dollar later offset much of that support. Prices fell during several phases even as inflation stayed high, showing that real yields and policy expectations can outweigh headline inflation.
2023–2026: Central Bank Demand and New Historic Highs
Banking stress in 2023, including failure of Silicon Valley Bank, renewed interest in defensive assets. The metal then accelerated through 2024 and 2025 amid central-bank buying, ETF flows, rate-cut expectations, and geopolitical tension. World Gold Council reported 53 new benchmark highs in 2025.
In 2026, LBMA data recorded a January high above $5,500 followed by a decline toward $4,000 by late June. That reversal made the start of the year especially important when measuring 2026 performance. (gold.org)
Key Market Events Shaping Gold Prices
Major events matter because they change expectations for growth, inflation, liquidity, and policy. Price response depends on what markets already anticipated, so an alarming headline does not always produce a lasting rally.
COVID-19 Pandemic and Global Economic Shutdowns
Pandemic shutdowns reduced visibility across global economy. Emergency rate cuts, asset purchases, government spending, and falling real yields supported investment demand. At same time, liquidity stress occasionally caused investors to sell bullion alongside other assets. That combination explains why 2020 produced both a strong uptrend and abrupt corrections.
Russia-Ukraine War and Geopolitical Risk
Invasion increased demand for assets perceived as stores of value and raised concerns about energy, food, sanctions, and reserve security. The metal benefited initially, but move was moderated by tighter U.S. policy and dollar strength. Geopolitical tensions may support bullion, yet their effect can fade when attention shifts to yields or inflation consequences.
Federal Reserve Rate Hikes and Rate-Cut Expectations
Bullion pays no interest, so higher real yields can increase opportunity cost of holding it. Rate cuts and loose monetary policy may have the opposite effect, particularly when they weaken dollar. Timing is difficult because markets often move before a decision is announced.
A detailed guide to how Fed rate decisions affect gold can help separate policy changes from market expectations.
Banking Stress, Recession Fears, and Market Volatility
Bank failures and recession concerns can increase demand for liquidity and capital preservation. Yet reactions differ by phase: early panic may cause broad selling, while later stabilization can support the market.
Traders using CFDs should consider spreads, slippage, overnight swaps, margin requirements, and leverage. A correct macro view can still lose money if position sizing cannot withstand volatility.
Major Gold Price Highs and Lows
Highs and lows reveal how quickly market narratives can reverse. They also show why entry price and risk controls matter even during a powerful long-term trend.
Notable Gold Price Highs During Past Decade
Important milestones included 2020 move above $2,000, repeated records in 2024, a much steeper advance in 2025, and a new all-time high in January 2026 that moved well above the previous all-time high.
Benchmark choice matters: an intraday futures quote, spot price, and London fixing may print different peaks. Always state source and timestamp when comparing records.
Major Corrections and Consolidation Periods
The metal corrected after 2020 peak, traded sideways through much of 2021 and 2022, and experienced another severe pullback after January 2026 surge. LBMA reported a fall of nearly 27% from its January 2026 AM high to June close. Such moves are normal reminders that bullish fundamentals do not eliminate downside risk. (lbma.org.uk)
Events Behind Sharpest Price Movements
Largest moves typically followed changes in several variables at once:
- sudden shifts in rate expectations;
- sharp changes in Treasury yields or dollar strength;
- military escalation or de-escalation;
- banking and liquidity stress;
- strong ETF inflows or outflows;
- profit-taking after crowded positioning.
Using a gold trading with economic calendar approach can help you identify when scheduled releases may amplify an already sensitive market.
Factors Driving Gold Price Changes
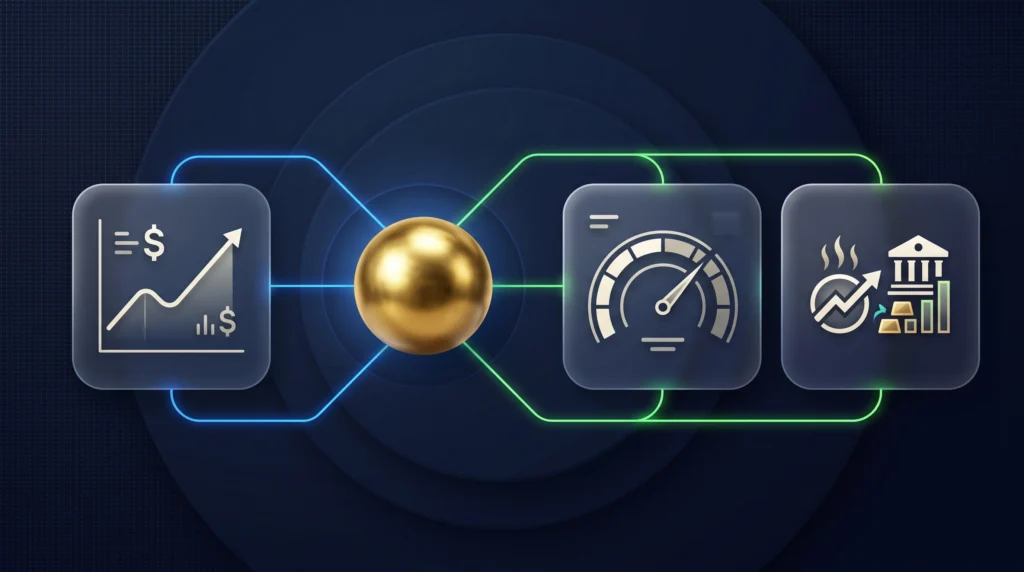
No single model explains every move. The asset responds to a network of macroeconomic, financial, and physical-market forces whose importance changes over time.
US Dollar, Interest Rates, and Treasury Yields
The metal often weakens when dollar and real Treasury yields rise, because metal becomes more expensive for non-dollar buyers and offers no coupon. Phrase “stronger dollar makes gold cheaper” is incomplete: in local currency terms, gold may become more expensive. During severe stress, both dollar and gold can rise together as investors seek liquidity and safety.
Inflation, Central Bank Buying, and Investor Demand
Inflation can support gold when it reduces confidence in cash returns, but high inflation can also prompt rate hikes that pressure prices. CPI should therefore be read with wage growth, policy expectations, and real yields. This guide to how CPI data affects gold prices adds practical context.
Central-bank purchases have become an important structural source of demand. World Gold Council data showed 863 tonnes of net purchases in 2025 and 244 tonnes in Q1 2026, despite elevated prices. Physical supply, recycling, jewellery demand, gold coins, bars, and ETF activity also influence supply and demand balance. (gold.org)
Gold Performance Versus Other Assets
Gold should be compared with assets that play different portfolio roles and preserve or compound value over time in different ways. A result depends on timeframe, currency, dividends, storage costs, taxes, and volatility.
Gold Versus S&P 500 Over Time
Stocks represent ownership in productive businesses and may generate earnings and dividends. Gold produces no cash flow but may diversify equity risk in some periods. Comparing gold with S&P 500 should use total return for equities, not price return alone. Leadership can change sharply across crises, recoveries, and inflation regimes.
Gold Versus US Dollar
Because global gold is commonly quoted in USD, dollar weakness can support metal. Investors outside U.S. experience an additional currency effect. A rising USD gold quote does not guarantee an equal gain in euros, pounds, or yen, and changing exchange rates can either increase or reduce local returns.
Gold Versus Inflation
Gold is often described as a hedge against inflation, but its short-term relationship with CPI is inconsistent. It may preserve value over long periods while falling during individual inflationary months or years. Real interest rates, monetary credibility, and starting valuation help determine whether inflation is supportive or negative.
Physical Gold Versus Gold ETFs
Physical gold bullion offers direct ownership but involves premiums, storage, insurance, verification, and resale spreads. Gold ETFs may offer easier market access and tighter trading costs, but investors should examine structure, custody, fees, and tracking. Those who buy physical gold should compare reputable dealers and know difference between collectible gold coins and investment-grade products.
Historical Gold Price Outlook
History can frame scenarios, but it cannot provide a reliable target by itself. Most useful outlook identifies supportive forces, downside risks, and signals that would challenge base case.
Lessons From 10-Year Gold Price History
Five practical lessons stand out:
- Gold can rise during uncertainty but still suffer deep corrections.
- Policy expectations often matter more than announced decisions.
- New records can attract momentum while increasing reversal risk.
- Currency choice changes investor experience.
- Diversification benefits depend on entry point and holding period.
Current Trends Supporting Gold Demand
Supportive conditions may include continued reserve diversification, persistent geopolitical risk, concerns about government debt, lower real yields, and renewed ETF demand. World Gold Council reports described historically elevated central-bank buying and strong investment interest through 2025 and early 2026. These forces may support a bull market, but their persistence should not be assumed. (gold.org)
Risks Capable of Pressuring Gold Prices
Gold may face pressure from:
- higher real interest rates;
- sustained dollar appreciation;
- easing geopolitical risk;
- ETF outflows and profit-taking;
- weaker retail demand at elevated prices;
- faster growth that favors risk assets.
Leveraged traders should also account for margin calls. Required Margin equals Trade Size divided by Leverage, but broker rules, instrument specifications, and volatility adjustments can change actual amount.
Historical Patterns and Future Price Scenarios
A constructive scenario could combine falling real yields, softer dollar conditions, reserve buying, and renewed investor inflows. A neutral case might involve consolidation after a major rally. A bearish case could emerge if growth remains resilient, policy stays restrictive, and investment demand retreats. Scenario planning is more robust than relying on one forecast or chart pattern.
Limits of Gold Price Forecasting
Gold forecasts are highly sensitive to assumptions about interest rates, inflation, exchange rates, conflicts, and investor positioning. Technical levels may indicate areas of support or resistance, but they do not guarantee direction. Traders should consider stop placement, position size, execution quality, spreads, swaps, commissions, and broker comparison before choosing to trade gold.
FAQ
How Much Has Gold Price Changed Over Past 10 Years?
Gold rose substantially from low-$1,100s seen during parts of 2016 to around $4,000 in mid-2026, despite a major correction from January’s peak. Exact return depends on chosen start date, end date, benchmark, and currency. A local-currency investor may record a different result because exchange-rate movements can magnify or reduce USD return.
Which Year Recorded Highest Gold Price?
Based on available benchmark data through July 2026, 2026 recorded highest nominal price. LBMA reported an AM fixing above $5,500 per ounce on January 29 before a steep decline. Other feeds may show a slightly different record because futures, spot, and London benchmark prices use different markets and timestamps.
Why Did Gold Price Rise During COVID-19?
Gold rose as pandemic disruption increased uncertainty, central banks cut rates, governments expanded spending, and real yields declined. Investors also sought diversification from equities and fiat currency risk. Move was not one-directional: liquidity stress and profit-taking caused sharp selloffs, which illustrates why gold can be defensive over a broader period while remaining volatile day to day.
How Do Interest Rates Affect Gold Prices?
Higher real interest rates can pressure gold because interest-bearing assets become more attractive relative to a metal that pays no income. Lower rates may support it by reducing that opportunity cost and sometimes weakening dollar. Relationship can break temporarily when banking stress, inflation fears, or geopolitical events dominate investor decisions.
Which Market Events Have Biggest Impact on Gold?
Events that change interest-rate expectations, real yields, currency confidence, liquidity, or geopolitical risk tend to have greatest effect. Examples include central-bank decisions, inflation reports, banking failures, wars, trade disputes, recessions, and emergency stimulus. Impact depends on surprise: a widely expected event may produce less movement than a smaller development that changes market outlook.
How Did Bretton Woods Agreement Shape Historical Prices?
The Bretton Woods Agreement created a system of fixed exchange rates linked to the U.S. dollar, while the United States fixed the price of gold at $35 per ounce for official convertibility. The Bretton Woods system weakened before dollar convertibility was suspended in 1971, opening the way for market-driven pricing. This background helps explain why modern prices react to confidence in currencies and monetary institutions.
Where Can Investors Check Current Price and Price Data?
The current price can be checked through established benchmark administrators, major exchanges, reputable market-data providers, and regulated brokers. Gold investors should verify whether a quote represents spot, futures, or a daily fixing and note its timestamp and currency. Gold can be bought physically or accessed through exchange-traded and derivative products, but costs, custody, leverage, and counterparty exposure differ.
Can Historical Gold Trends Predict Future Prices?
Historical trends can identify recurring relationships, volatility patterns, and important price zones, but they cannot predict future prices with certainty. Market structure, policy, and investor behavior evolve. A historical chart is most useful when combined with macroeconomic analysis, risk management, and clearly defined scenarios rather than treated as a standalone trading signal.