Forex Technical Analysis: Charts and Indicators for Beginners

Forex technical analysis is the study of historical price data through charts, patterns, market structure, and technical indicators. Traders use forex technical analysis to organize price information from the foreign exchange market into a visual format that may help identify trends, support and resistance areas, and momentum. This approach forms one part of a broader foundation of forex trading basics that beginners are often encouraged to understand before exploring the forex market further.
Charts and technical indicators are commonly used because raw price data, on its own, can be difficult to interpret. By plotting price against time, technical analysis tools can highlight recurring patterns in how a currency pair has behaved. This article is a beginner-level overview of forex chart types, price structure, timeframes, common technical indicators, and the limitations traders often consider when using them.
Key Takeaways
- Forex technical analysis relies on charts, OHLC (open, high, low, close) data, and price patterns rather than primarily on economic data.
- Line, bar, and candlestick charts each present price information with different levels of detail.
- Trends, support and resistance, and chart patterns describe recurring price structures observed on a chart.
- Technical indicators such as moving averages, RSI, and MACD can add context around trend, momentum, or volatility.
- Different timeframes—from minutes to daily, weekly, or monthly—can show different levels of market detail.
- No single technical analysis tool can reliably predict future price movements, and past performance does not guarantee future results.
What Is Forex Technical Analysis?
Technical analysis in the forex market focuses on studying historical price behaviour and recurring chart structures, rather than primarily examining economic or fundamental factors. Technical traders generally work from price charts, using tools designed to describe what ше has already done and how it may be structured going forward.
Core Concept of Technical Analysis
Technical analysis is built on the idea that price movements often reflect patterns that have appeared before. A trader using technical analysis typically studies price levels, chart patterns, and technical indicators to understand current market conditions, rather than focusing on the underlying economic causes of price movement.
Role of Price Data and Market Behaviour
Price, time, highs, lows, and closing levels form the foundation of any forex chart. Charting tools transform this raw historical price data into a visual format—lines, bars, or candlesticks—that can make patterns and price levels easier to observe over a selected period.
Technical Analysis vs Fundamental Analysis
Fundamental analysis examines economic indicators such as gross domestic product (GDP), interest rate decisions, inflation, and other economic data to assess a currency’s value. Technical analysis, by contrast, is centered on charts and historical price data. Many traders use both analysis techniques together rather than relying on just one.
| Aspect | Technical Analysis | Fundamental Analysis |
| Primary focus | Price charts, patterns, indicators | Economic data, interest rates, GDP |
| Data source | Historical price and volume | Economic reports, central bank policy |
| Typical use | Timing and chart-based context | Longer-term currency valuation |
| Example tool | Moving average, RSI, MACD | Interest rate decisions, inflation reports |
How Forex Charts Work
A forex chart displays changes in the exchange rate of a currency pair over a selected period. Understanding the basic structure of a chart is often described as a starting point before exploring more detailed analysis techniques.
Price and Time Axes
On a typical forex chart, the horizontal axis represents time, while the vertical axis represents price. As time progresses from left to right, the chart plots how the exchange rate of a currency pair has moved, which forms the visual basis for further analysis.
Open, High, Low, Close Data
OHLC data—open, high, low, and close—represents the four key price points within a given charting period. The open is the price at the start of the period, the high and low are the extremes reached during that period, and the close is the price at the end of the period.
Currency Pairs and Price Quotes
A currency pair, such as EUR/USD, is quoted as a base currency against a quote currency. The euro, for example, might be quoted against the United States dollar, where the price reflects how much of the quote currency is needed to purchase one unit of the base currency. This price is what moves on a forex chart.
Main Forex Chart Types
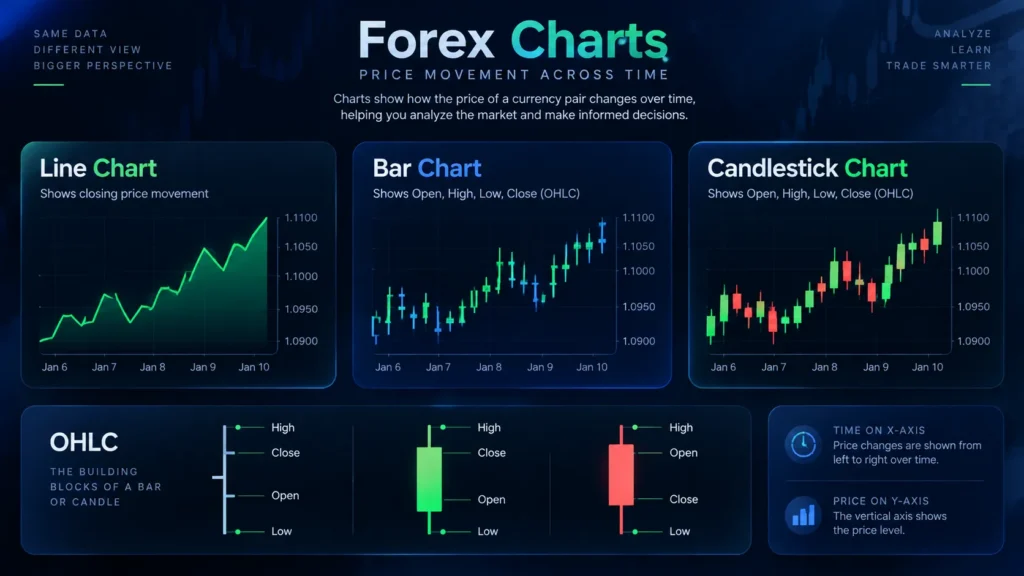
Different chart formats present the same underlying price data with varying levels of detail.
- Line charts – simplified, closing-price only
- Bar charts – shows open, high, low, close
- Candlestick charts – shows OHLC with a visual body and wicks
Line Charts
Line charts generally connect a series of closing prices with a single continuous line. This format offers a simplified view of overall price direction and is often used by beginners as an introduction to reading forex charts before moving to more detailed formats.
Bar Charts
Bar charts display open, high, low, and close information for each period using a vertical line with small horizontal ticks. This format provides more detail than a line chart, since it shows the full price range rather than only the closing price.
Candlestick Charts
Candlestick charts show a “body” representing the open and close, along with “wicks” (or shadows) representing the high and low. This format is widely used in technical analysis because it can visually communicate the relationship between opening and closing prices within a single glance.
Comparing Chart Types
Line charts emphasize overall direction, bar charts add price-range detail, and candlestick charts combine range and open/close relationships in a compact visual form. Beginners often start with line charts before progressing to candlesticks as they become more familiar with reading forex charts.
Reading Forex Price Action and Market Structure
Price action refers to the way a currency pair’s price moves and forms patterns on a chart over time.
Identifying Trends
Market conditions are often described as upward, downward, or sideways based on the sequence of highs and lows. An upward trend is typically associated with a series of higher highs and higher lows, while a downward trend shows lower highs and lower lows.
Support and Resistance
Support and resistance describe price areas where the market has historically shown reactions—such as pausing or reversing—rather than exact, fixed price lines. A resistance level is generally an area where upward price movement has previously slowed, while a support level is an area where downward movement has previously slowed.
Trend Lines and Channels
Trend lines are drawn by connecting a series of highs or lows to visually organize directional price movement. When two parallel trend lines are drawn, they can form a channel, which some traders use to observe recurring areas of price interaction.
Common Chart Patterns
Recurring formations such as double tops, double bottoms, triangles, and head and shoulders patterns are sometimes monitored by technical analysts. These chart patterns are descriptive structures that market participants observe on a chart, rather than guaranteed signals of future price movement.
Timeframes in Forex Technical Analysis
Forex charts can be viewed across a range of timeframes, from minutes to daily, weekly, or monthly periods.
Short-Term and Long-Term Charts
Shorter timeframes, such as a 5-minute or 15-minute chart, generally display more frequent price fluctuations and finer detail. Longer timeframes, such as daily or weekly charts, tend to smooth out short-term fluctuations and can highlight broader market structure.
Multiple Timeframe Analysis
Some analysts compare several timeframes at once—for example, reviewing a weekly chart alongside an hourly chart—to view broader market structure together with more detailed price behaviour within the same currency pair.
Market Noise and Timeframe Limitations
A pattern or technical signal that appears on one timeframe does not necessarily apply to another. Short-term charts can contain a higher degree of market noise, which may make chart patterns or indicator readings less consistent compared with longer-term charts.
Common Forex Technical Indicators
Technical indicators are mathematical calculations based on price, volume, or time, applied to a chart to provide additional context.
| Indicator | Category | What It Measures |
| Moving Average | Trend | Smoothed average of historical price |
| Relative Strength Index (RSI) | Momentum | Speed and strength of recent price changes |
| MACD | Momentum/Trend | Relationship between two moving averages |
| Bollinger Bands | Volatility | Price variability around a moving average |
| Stochastic Oscillator | Momentum | Closing price relative to recent price range |
| Average True Range (ATR) | Volatility | Degree of price movement |
Moving Averages
A moving average smooths historical price data over a selected number of periods, which can help illustrate the general direction of a trend. Moving averages are commonly associated with observing changes in market direction over time.
Relative Strength Index
The Relative Strength Index (RSI) is a momentum oscillator that measures the strength and speed of recent price movements on a scale of 0 to 100. Readings above 70 are often discussed as “overbought,” while readings below 30 are often discussed as “oversold,” though these levels are descriptive rather than predictive.
Moving Average Convergence Divergence
MACD is an indicator based on the relationship between two moving averages and is commonly used to examine momentum and potential changes in directional movement. It is typically displayed with a signal line and a histogram.
Bollinger Bands
Bollinger Bands combine a moving average with two bands plotted at a set number of standard deviations away from that average. This structure can illustrate periods of relatively higher or lower price variability, or volatility, on a chart.
Stochastic Oscillator
The Stochastic Oscillator compares a currency pair’s closing price with its recent price range over a set number of periods. It is commonly used as a momentum indicator and is often displayed alongside overbought and oversold reference levels.
Average True Range
Average True Range (ATR) is a volatility indicator that measures the degree of price movement over a given period, without indicating direction. A rising ATR is generally associated with increasing volatility, while a falling ATR is associated with decreasing volatility.
How Technical Indicators Complement Charts
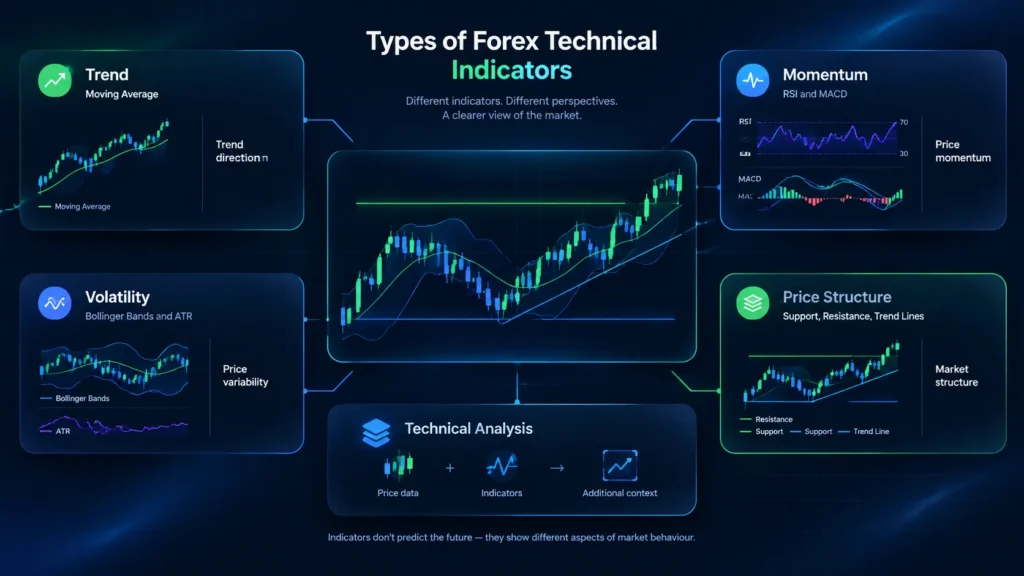
Indicators are typically used alongside, rather than instead of, chart patterns and price structure.
- Trend indicators summarize the general direction of price
- Momentum indicators describe the pace of price movement
- Volatility indicators describe the magnitude of price movement
Trend Indicators
Tools such as moving averages can add context to a visible price trend by summarizing price movement over a selected period, which may make the general direction of the market easier to observe on a chart.
Momentum Indicators
RSI, MACD, and the Stochastic Oscillator can provide additional information about the strength or pace of recent price movements, which some analysts use alongside chart patterns for further context.
Volatility Indicators
Tools such as Bollinger Bands and ATR focus on the magnitude and changing intensity of price movements, rather than direction, which can add another layer of context to a chart.
Avoiding Indicator Overload
Adding a large number of indicators to a single chart can make interpretation more difficult, particularly when several tools are derived from similar underlying price data and therefore display overlapping information.
Benefits and Limitations of Forex Technical Analysis
Like any analysis technique, forex technical analysis has both potential benefits and notable limitations.
Potential Benefits
Technical analysis can provide a structured, visual framework for studying price history, trends, chart patterns, momentum, and volatility, which some traders find useful for organizing large amounts of price data.
False Signals and Changing Market Conditions
Chart patterns and indicator readings can fail to play out as historically observed, particularly during unusually volatile conditions or when broader market conditions shift, such as around major economic data releases.
Lagging Nature of Many Indicators
Many technical indicators, including moving averages and MACD, are calculated from historical price data. As a result, these tools may reflect price movement that has already occurred rather than movement that is currently developing.
Subjectivity in Chart Interpretation
Different analysts may interpret the same chart, support and resistance levels, chart pattern, or indicator reading differently, which means technical analysis is not always applied consistently between market participants.
Common Beginner Mistakes in Technical Analysis
New traders exploring forex technical analysis sometimes encounter a few recurring challenges.
- Relying on a single indicator
- Confusing correlation with prediction
- Ignoring broader market context
- Overcomplicating charts with excessive tools
Relying on One Indicator
A single indicator generally provides only a limited view of market conditions and cannot capture every relevant aspect of price behaviour, such as trend, momentum, and volatility all at once.
Confusing Correlation with Prediction
A historical relationship between a chart pattern or indicator reading and subsequent price movement does not guarantee that the same movement will follow in future instances.
Ignoring Broader Market Context
Economic data releases, changing liquidity conditions, and shifts in market sentiment can affect price behaviour even when a chart pattern appears clearly defined, which is one reason some traders also study forex trading chart patterns alongside broader market context.
Overcomplicating Charts
Adding excessive indicators, trend lines, and pattern annotations to a single chart can make the underlying price structure harder to interpret, which is why some educational resources on beginner forex strategies emphasize simplicity when first learning to read charts.
For traders exploring how chart-based observations are sometimes shared or discussed among market participants, resources covering forex trading signals may provide additional educational context.
FAQ
What is forex technical analysis?
Forex technical analysis is the study of historical price data, charts, chart patterns, and technical indicators to describe how a currency pair has moved and how it may currently be structured. It focuses on price behaviour rather than underlying economic factors.
What chart is commonly used for forex technical analysis?
Line, bar, and candlestick charts are all used in forex technical analysis, with candlestick charts particularly widely used because they display open, high, low, and close data in a compact visual form.
What are the most common forex indicators?
Commonly discussed forex technical indicators include moving averages, the Relative Strength Index (RSI), MACD, Bollinger Bands, the Stochastic Oscillator, and Average True Range (ATR), each associated with trend, momentum, or volatility.
Can technical analysis predict forex prices?
Technical analysis can help describe historical and current market behaviour and organize price data into patterns, but it cannot guarantee future price direction. Indicators and chart patterns reflect past or current data rather than certain outcomes.
What is the difference between technical analysis and fundamental analysis?
Technical analysis is centered on charts, price data, and indicators, while fundamental analysis examines economic data such as interest rates, inflation, and gross domestic product to assess a currency’s underlying value.
Which timeframe is best for forex technical analysis?
There is no single timeframe considered universally applicable. Shorter timeframes generally display more price fluctuations and detail, while longer timeframes tend to show broader market structure with less noise.
Are forex indicators accurate?
Technical indicators are mathematical calculations based on historical or current market data. They can provide useful context around trend, momentum, or volatility, but their readings are not guaranteed forecasts of future price movement.
Can beginners learn forex technical analysis?
The core concepts of forex technical analysis—charts, OHLC data, trends, support and resistance, candlesticks, and basic indicators—can be studied progressively as an educational subject, often alongside a demo account for practice purposes.