
Forex Trading Chart Patterns: Common Formations Beginners Should Know


Forex trading involves interpreting recurring shapes that appear on a price chart over time. These shapes, known as chart patterns, are widely discussed in forex technical analysis because they summarize how price has moved between periods of buying pressure and selling pressure. This article introduces forex trading for beginners to the main categories of charts, the terminology used to describe them, and why chart pattern analysis is treated as descriptive rather than predictive.
This guide focuses on the formations beginners encounter most often: head and shoulders, double and triple tops and bottoms, flags, pennants, triangles, wedges, and the cup and handle pattern. Each section explains what the formation looks like, how it is typically classified, and how traders and analysts generally interpret it within the wider context of market trend and price action.
Key Takeaways
- A chart pattern is a recurring visual formation on a price chart that reflects the relationship between support and resistance over a given period.
- The three major pattern groups are reversal, continuation, and bilateral charts, each associated with a different type of market behavior.
- Common reversal charts include head and shoulders, inverse head and shoulders, double top, double bottom, and their triple variations.
- Common continuation charts include flags, pennants, ascending and descending triangles, and the cup and handle formation.
- Triangle and wedge patterns share visual similarities but are typically classified differently based on trendline direction and market context.
- Chart patterns can fail, and confirmation, timeframe, and broader market conditions are generally considered when interpreting any formation.
What Are Forex Chart Patterns?
A forex chart pattern is a recognizable arrangement of price highs and lows that forms as buyers and sellers interact on a price chart. Before looking at specific formations, it helps to understand how these shapes develop and why they are treated as part of technical analysis rather than as fixed rules.
How Chart Patterns Form on Price Charts
A chart pattern typically forms as price repeatedly tests certain highs or lows, creating identifiable boundaries of support and resistance. As supply and demand shift at these boundaries, the resulting price action can trace out shapes such as triangles, double tops, or head and shoulders formations. A chart pattern is generally understood as a graphical representation of past price behavior rather than a precise forecast of what price will do next.
Reversal, Continuation, and Bilateral Patterns
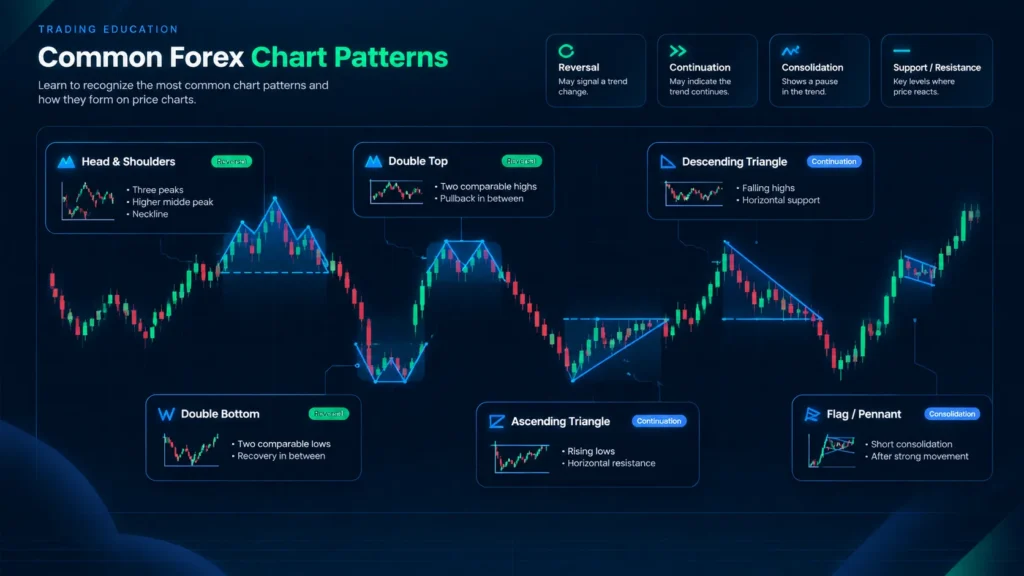
Reversal charts are typically associated with a possible change in an existing market trend, such as a shift from an uptrend to a downtrend. Continuation patterns are generally linked to a temporary pause within a prevailing trend, after which the trend may resume in the same direction. Bilateral charts, such as certain triangles, are often considered directionally neutral, meaning price could move higher or lower once the formation resolves.
| Pattern Type | Typical Association | Example Formations |
| Reversal | Possible change in prevailing trend | Head and shoulders, double top, double bottom |
| Continuation | Possible pause before trend resumes | Flags, pennants, cup and handle |
| Bilateral | Uncertain direction until resolution | Symmetrical triangle |
Why Chart Patterns Matter in Technical Analysis
Chart patterns matter in technical analysis because they give traders and analysts a shared vocabulary for describing market structure, momentum, and consolidation. A chart can be interpreted as a visual summary of shifting market sentiment between buyers and sellers. Analysts sometimes use these formations alongside other indicators to build a broader picture of how an asset’s price has behaved, though this remains descriptive rather than predictive.
Common Forex Reversal Chart Patterns
Reversal chart patterns are among the most frequently discussed formations in forex trading charts. The following sections describe the structure of several common reversal patterns and how they are typically classified.
Head and Shoulders
The head and shoulders pattern consists of three peaks: a left shoulder, a higher peak called the head, and a right shoulder that is roughly similar in height to the left shoulder. A trend line connecting the lows between these peaks is known as the neckline. This formation is traditionally associated with a potential bearish reversal following an uptrend, though outcomes can vary depending on market context.
Inverse Head and Shoulders
The inverse head and shoulders mirrors the standard formation, consisting of three troughs — a left shoulder, a lower head, and a right shoulder — connected by a neckline. This structure is commonly associated with a possible bullish reversal following a downtrend. As with the standard version, the pattern describes a historical tendency rather than a guaranteed price outcome.
Double Top and Double Bottom
A double top pattern forms an M-shape, where price tests a similar resistance level twice without breaking through, while a double bottom forms a W-shape at a similar support level. Both formations reflect two attempts by price to move beyond a particular boundary. A double top or bottom is generally interpreted as a potential reversal structure, particularly when accompanied by weakening momentum on the second attempt.
Triple Top and Triple Bottom
Triple top and triple bottom formations are less common extensions of the double pattern, involving three tests of a similar resistance or support level rather than two. Because three unsuccessful attempts to break a level can reflect a more sustained shift in market pressure, some analysts view triple formations as a stronger — though still not guaranteed — signal of potential reversal compared with a single double top or bottom.
Common Forex Continuation Chart Patterns
Continuation patterns generally appear as brief pauses within an established market trend. This section outlines several continuation charts commonly discussed in forex trading.
Flags
A flag pattern typically forms as a short, roughly parallel consolidation channel following a sharp price movement, sometimes described as the “flagpole.” A bullish flag tends to slope against a preceding uptrend, while a bearish flag slopes against a preceding downtrend. Flags are generally interpreted within the context of the trend that preceded them rather than in isolation.
Pennants
A pennant resembles a small symmetrical triangle rather than a parallel channel, formed by converging trendlines following a strong directional move. Like flags, pennants are commonly viewed as brief consolidation formations that develop after a pronounced price movement, with the converging structure distinguishing a pennant from the roughly parallel boundaries of a flag.
Ascending and Descending Triangles
An ascending triangle typically features a horizontal resistance line combined with a series of progressively higher swing lows, while a descending triangle features horizontal support combined with progressively lower swing highs. These formations are often associated with a directional bias tied to the flat boundary, though — as with all chart patterns — the eventual outcome is not guaranteed and depends on broader market conditions.
Cup and Handle
The cup and handle pattern consists of a rounded, U-shaped price movement known as the cup, followed by a smaller consolidation or pullback referred to as the handle. This formation is generally classified as a bullish continuation pattern and can take considerably longer to develop than shorter-term formations such as flags or pennants, sometimes spanning weeks or months on a price chart.
Triangle and Wedge Formations
Triangles and wedges share a converging visual structure, which can make them easy to confuse. The sections below describe how each is typically defined and distinguished within forex trading charts.
Symmetrical Triangles
A symmetrical triangle forms when two converging trendlines — one sloping down from swing highs and one sloping up from swing lows — narrow the trading range over time. Because neither trendline is horizontal, symmetrical triangles are often considered bilateral charts rather than inherently bullish or bearish, with the eventual breakout direction generally viewed as uncertain until it occurs.
Rising and Falling Wedges
A wedge pattern forms when two converging trendlines slope in the same direction, either upward or downward. A rising wedge is traditionally associated with a potentially bearish outcome, while a falling wedge is traditionally associated with a potentially bullish outcome. Wedges can appear as reversal formations after an established trend or, in some cases, within continuation structures.
Differences Between Triangles and Wedges
Triangles and wedges can look similar, but they are typically classified using several distinguishing factors, summarized below.
| Factor | Triangle | Wedge |
| Trendline direction | One flat, one sloped (or both converging from opposite directions) | Both slope in the same direction |
| Common classification | Often bilateral or continuation | Often associated with reversal |
| Typical market context | Consolidation within range-bound price action | Often follows an extended trend |
| Price compression | Narrows toward apex | Narrows while trending |
How to Read Common Chart Patterns in Forex Markets
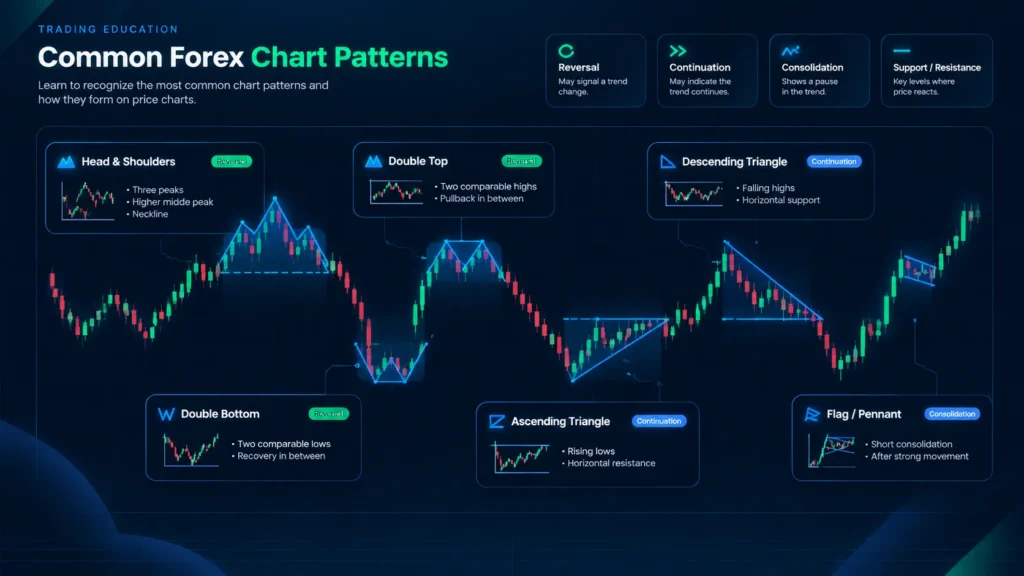
Reading a chart pattern involves more than recognizing its shape. Several contextual factors are commonly considered alongside the formation itself.
- The prevailing market trend at the time the pattern develops
- Nearby support and resistance levels or a relevant resistance line
- The timeframe on which the pattern appears
- Whether a breakout has been confirmed or remains incomplete
Role of Trend and Market Context
The same chart pattern can carry different significance depending on whether it develops during an established uptrend, a downtrend, or a sideways market. A double top forming after a strong uptrend, for example, may be interpreted differently than a similar shape appearing within a range-bound market with no clear prevailing trend.
Support and Resistance
Support and resistance levels often form the boundaries of a chart pattern, since price formations tend to develop around price areas that have previously attracted buying or selling interest. A level of resistance tested multiple times, or a support level that repeatedly holds, can help explain why certain formations recur at particular price areas.
Timeframe and Pattern Size
Chart patterns can appear on short-term intraday charts as well as longer-term weekly or monthly charts. The timeframe on which a formation develops can influence its visual size, the number of periods it takes to complete, and how much weight analysts place on it relative to the broader market trend.
Confirmation and Pattern Failure
Confirmation generally refers to price closing beyond a key boundary of the formation, such as a neckline or trendline, which some analysts use to distinguish a developing pattern from one considered complete. False breakouts and failed formations are common, and no chart pattern — regardless of how clearly it appears to form — provides certainty about future price direction.
Common Mistakes When Interpreting Forex Charts
Even well-known formations can be misread. The following are frequently discussed pitfalls in chart pattern analysis.
- Identifying a pattern where price movement is largely random
- Overlooking broader market trend, volatility, or liquidity conditions
- Treating a formation as a guaranteed signal rather than a descriptive framework
- Confusing visually similar patterns, such as flags with pennants
Readers considering beginner forex strategies or evaluating forex alerts may wish to review this risk information alongside any educational material on chart patterns.
Seeing Patterns in Random Price Movement
One common mistake involves identifying a familiar shape, such as a double top or a triangle, in price movement that does not actually meet the structural criteria for that formation. Distinguishing an established chart pattern from ordinary market fluctuation generally requires clearly defined highs, lows, and boundaries rather than a loosely similar shape.
Ignoring Broader Market Context
Economic events, shifts in volatility, prevailing trend conditions, and overall market liquidity can all affect how a chart pattern develops and whether it behaves as historically expected. A formation identified without regard to this wider context may be interpreted differently than one considered alongside current market conditions.
Treating Patterns as Guaranteed Signals
Charts are best understood as analytical frameworks that describe historical tendencies rather than guarantees of future price behavior. Even widely recognized formations, such as head and shoulders or double top and bottom patterns, can fail to produce the traditionally associated outcome, particularly during periods of unusual volatility or unexpected market news.
Confusing Similar Formations
Flags and pennants, triangles and wedges, and double and triple formations can all appear visually similar at first glance. Distinguishing them generally comes down to structural details — whether trendlines are parallel or converging, whether they slope in the same or opposite directions, and how many times a support or resistance level has been tested.
Forex Chart Patterns FAQ
What Are the Most Common Forex Chart Patterns?
The most commonly discussed forex charts include head and shoulders, double tops and bottoms, ascending and descending triangles, flags, pennants, rising and falling wedges, and the cup and handle formation. Each is generally classified as a reversal, continuation, or bilateral pattern depending on its structure and typical market context.
What Is the Difference Between Reversal and Continuation Patterns?
Reversal patterns are generally associated with a possible change in an existing market trend, while continuation patterns describe a pause that may precede a resumption of the existing trend. This reversal or continuation classification depends on the formation’s shape and where it appears relative to the prevailing trend.
Are Forex Chart Patterns Reliable?
The reliability can vary depending on market conditions, the timeframe used, the clarity of the formation, and how it is interpreted alongside other factors. No chart pattern guarantees a particular future outcome, and historically recognized formations can and do fail under certain market conditions.
Which Chart Patterns Are Easiest for Beginners to Recognize?
Visually straightforward formations such as double tops, double bottoms, flags, and basic triangle patterns are often considered easier for beginners to identify due to their relatively simple structure. This does not imply that these formations are inherently more reliable than more complex patterns, only that their shapes tend to be more visually distinct.
Can Forex Chart Patterns Fail?
Yes, forex chart patterns can fail through false breakouts, incomplete formations, or mistaken recognition where the identified shape did not meet the structural criteria in the first place. Changing market conditions, unexpected news events, and shifts in liquidity are commonly cited reasons why an apparently established pattern may not develop as historically expected.
Do Chart Patterns Work on All Forex Timeframes?
Chart patterns can appear across a wide range of timeframes, from short-term intraday charts to longer-term weekly or monthly charts. However, their duration, visual structure, and the market context surrounding them can differ considerably between shorter and longer timeframes, which is generally taken into account during chart pattern analysis.