Candlestick Patterns for Gold Trading: Reversals, Continuations, Entry Signals

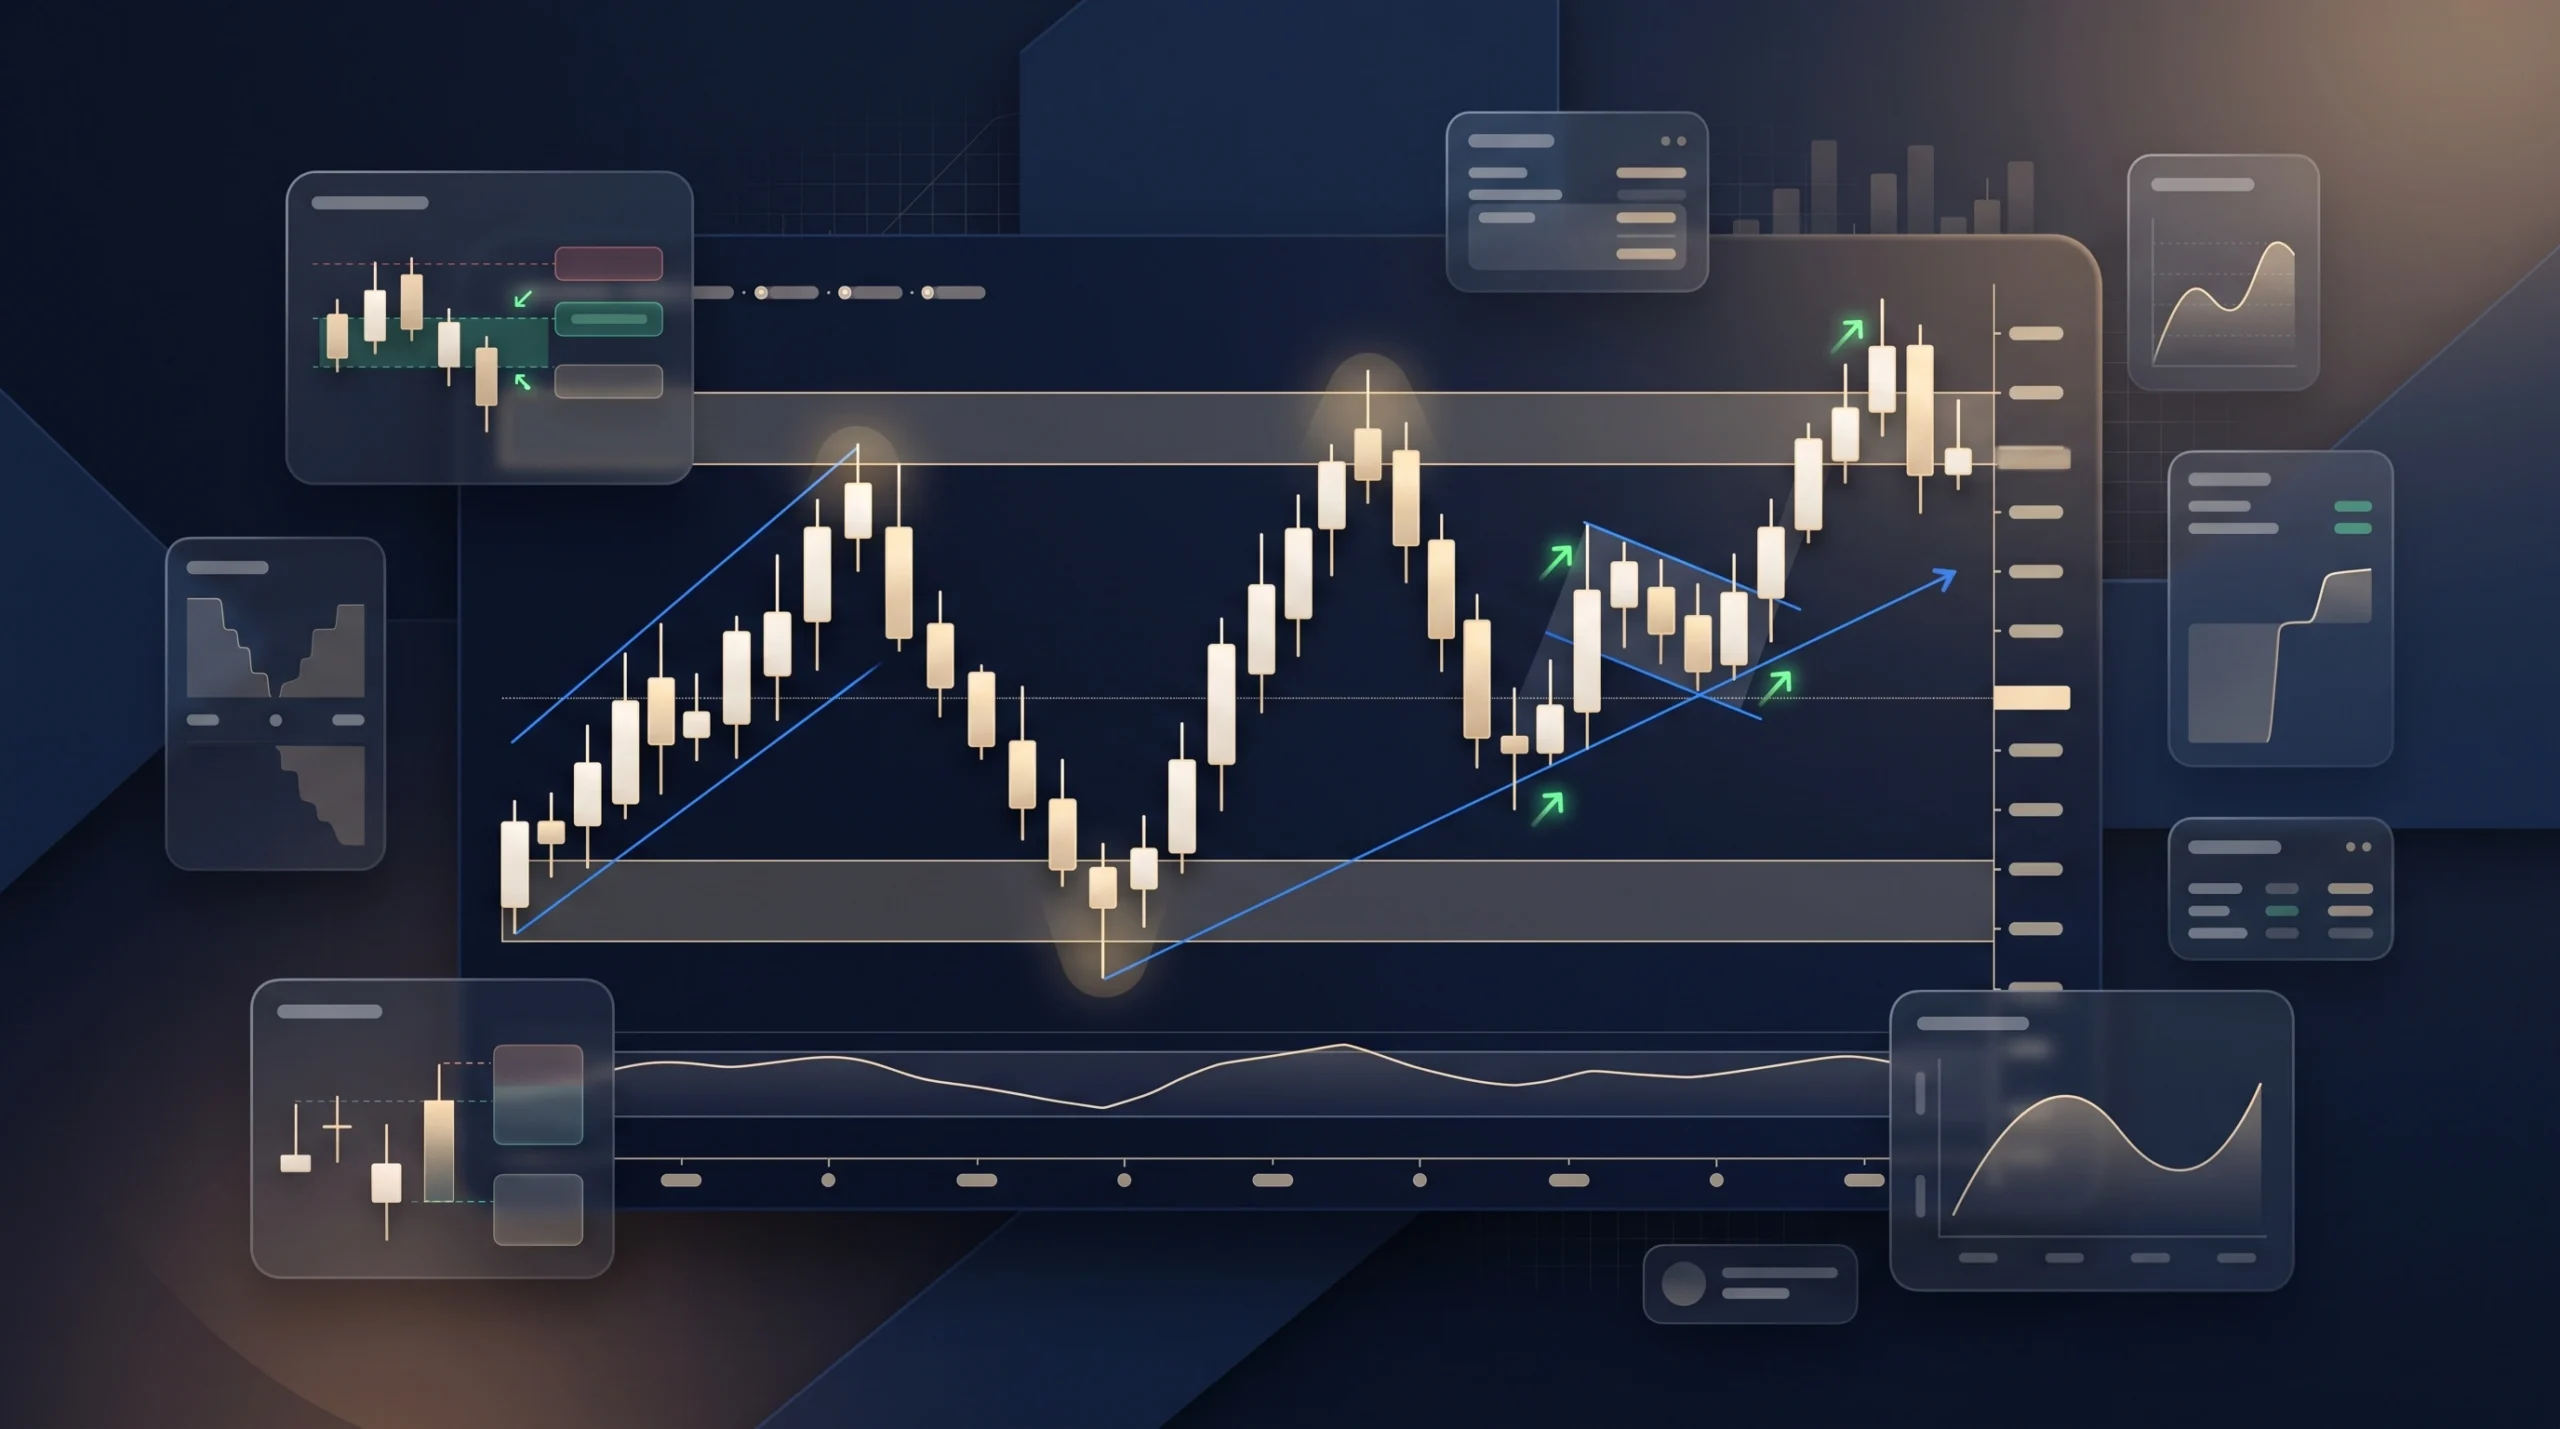
Gold candlestick patterns organize price action into repeatable visual signals. A candle can show whether buyers or sellers dominated a period, but no formation predicts market direction with certainty. Gold reacts quickly to interest-rate expectations, currency moves, geopolitical events, and risk sentiment, so context matters as much as shape.
This guide covers reversal, continuation, and entry signals for gold and gold CFDs, alongside confirmation, execution, and risk controls. Treat every setup as a probability and account for spreads, swaps, leverage, margin requirements, and volatility.
Key Takeaways for Gold Candlestick Trading
Reversal, Continuation, Entry Signal Overview
A reversal candlestick may suggest that an existing move is losing strength. Continuation formations, by contrast, indicate that a pause could resolve in the direction of the broader trend. Entry signals combine a pattern with location, confirmation, and a defined invalidation point.
Useful distinctions include:
- Reversal signals matter most near established support or resistance.
- Continuation signals are stronger when aligned with a clear trend.
- Single-candle patterns need more confirmation than many multi-candle structures.
- Entry quality depends on risk-reward, not only pattern accuracy.
- News-driven volatility can invalidate otherwise clean technical setups.
Gold Volatility, Liquidity, Timeframe Context
Gold is actively traded across major global sessions, yet liquidity and spread conditions can change during rollovers, holidays, and sudden news events. A hammer candlestick on a five-minute chart may reflect brief order flow, while the same pattern on a daily candlestick chart may represent a broader shift in positioning.
Timeframe choice should match your holding period. Day traders often combine intraday patterns with higher-timeframe direction, while swing traders may start with daily or four-hour structure and use shorter charts to refine entries. New traders may benefit from reviewing how to trade gold for beginners before applying pattern-based setups.
Candlestick Pattern Definition and Market Function

Candlestick patterns visualize changes in buying and selling pressure during a selected period. Their meaning depends not only on candle shape but also on market structure, location, and surrounding price action.
Gold Price Action Meaning and Market Interpretation
Each candle records opening, high, low, and closing prices for a selected period. A bullish candle closes above its open, while a bearish candle closes below it. The body reflects the distance between open and close; upper and lower wicks show prices tested but not maintained.
A small body with a long lower wick may indicate rejection of lower prices. A long bearish candle can show decisive selling, but location changes its meaning. Near resistance it may support a bearish view; in the middle of a range it may offer little information.
Why Candlestick Patterns Work in Gold Markets
Candlestick formations are useful because they display changes in participation and momentum. When a decline reaches a support level and buyers rapidly recover losses, the resulting wick may reveal demand. When an uptrend stalls near resistance and closes weakly, it may suggest distribution or profit-taking.
Patterns work best as a language of market behavior, not a mechanical forecasting system. Traders using gold trading strategies can combine candle signals with trend structure, macroeconomic awareness, and risk management. This may reduce low-quality trades, though it does not guarantee profitable trading.
Reversal, Continuation, Single-Candle, Multi-Candle Classification
Gold price patterns can be grouped by function.
| Pattern group | Typical examples | Main purpose | Confirmation need |
| Single-candle reversal | Hammer, shooting star, doji | Flag possible exhaustion | High |
| Multi-candle reversal | Engulfing pattern, morning star | Show shift in control | Moderate to high |
| Continuation | Rising three methods, inside bar | Identify pause within trend | Moderate |
| Chart reversal | Head and shoulders, double top | Map broader structural change | High |
A pattern may form over one or several periods, but classification is not absolute. A doji can precede reversal or continuation, so location, trend quality, and the next candle determine the stronger interpretation.
Gold Candlestick Pattern Identification and Signal Confirmation
Reliable identification requires traders to examine trend context, support and resistance zones, candle proportions, and timeframe relevance. Waiting for confirmation may reduce premature entries, although it cannot eliminate false signals.
Trend Context and Market Cycle Phases
Start by defining whether gold is trending, ranging, or transitioning. An uptrend generally makes higher highs and higher lows; a downtrend does the opposite. Reversal patterns in forex trading and gold matter more after an extended move than during random sideways action.
Market cycles often move through expansion, slowing momentum, consolidation, and renewed expansion. A potential reversal may appear as a mature trend transitions, but traders should avoid labeling every pause as a trend reversal.
Support and Resistance Zones
Treat support or resistance as an area, not one exact price. Relevant zones may come from swing highs, swing lows, daily closes, gaps, moving averages, or repeated reactions. A bullish pattern near support is usually more useful than one in open space.
Three checks improve location quality:
- Price has reacted from the zone before.
- The zone is visible on a higher timeframe.
- The pattern shows rejection, not merely temporary hesitation.
- Confirmation closes away from the zone.
- Expected reward is reasonable relative to the stop distance.
Candle Bodies, Wicks, Gaps, Volume Clues
Body size indicates commitment, while wick length shows rejection or volatility. A close near the candle high may carry more weight than one near the midpoint. Consecutive bullish or bearish candles can confirm persistent demand or supply.
Gaps are less common in spot gold than in exchange-traded products, but they can appear after weekends or major events. Volume data also varies: futures volume is centralized, while CFD volume often reflects one platform. Know what your data represents.
Pattern Duration and Timeframe Selection
Pattern duration should fit the trade thesis. A two-candle setup on a one-minute chart is vulnerable to noise and execution costs, while a daily setup may require a wider stop, smaller position size, and patience.
A practical process is to identify market direction on a higher timeframe, locate a support or resistance zone, and then use a lower timeframe for confirmation. Traders interested in holding positions for several days can review how to swing trade gold for broader planning considerations.
Bullish Reversal Patterns for Gold Trading
Bullish reversal formations may appear when selling momentum weakens and buyers begin defending a significant price area. These signals generally carry more weight after a sustained decline and near established support.
Hammer and Inverted Hammer
A hammer candlestick has a small body near the top of its range and a long lower wick. It usually appears after bearish price action and may signal a potential change in market direction. The lower wick suggests sellers pushed price down before buyers recovered much of the move.
An inverted hammer candlestick has a small body with a long upper wick after a decline. It shows that buyers tested higher prices, but confirmation is important because the candle does not prove control. A close above the pattern high may strengthen the case, while a break below its low invalidates the setup.
Bullish Engulfing and Piercing Line
A bullish engulfing pattern forms when a bullish candle’s body covers the prior bearish body. Near tested support after a sustained decline, it may indicate strong buying pressure. A close near the high can add weight.
A piercing line uses two candles. The second opens weakly but closes above the midpoint of the first bearish candle. Traders often seek follow-through because an isolated recovery can fail.
Morning Star and Morning Doji Star
A morning star begins with a long bearish candle, continues with a small indecision candle, and ends with a strong bullish candle that recovers much of the first decline. A morning doji star uses a doji in the middle.
The pattern may indicate that bearish momentum is fading. Reliability tends to improve near support, after an extended decline, and when the third candle closes decisively. Entering before the final close can expose a trader to a pattern that never completes.
Bullish Harami and Bullish Harami Cross
A bullish harami forms when a small bullish or neutral candle sits within the body of a previous long bearish candle. A bullish harami cross uses a doji as the second candle. Both formations reflect contraction after strong selling pressure.
These are generally softer signals than a large engulfing candle. Traders may wait for a break above the first candle’s high or use momentum divergence, since compression can also lead to continuation.
Three White Soldiers, Dragonfly Doji, Tweezer Bottom
Three white soldiers consist of three consecutive bullish candles with firm closes, usually after a decline or base. The sequence can represent sustained buying pressure, but chasing the third candle may create poor risk-reward if price is already near resistance.
A dragonfly doji has similar open and close levels near the high, with a long lower wick. A tweezer bottom forms when two candles reject approximately the same low. Both may indicate support, yet neither is a reliable reversal without follow-through.
Bearish Reversal Patterns for Gold Trading
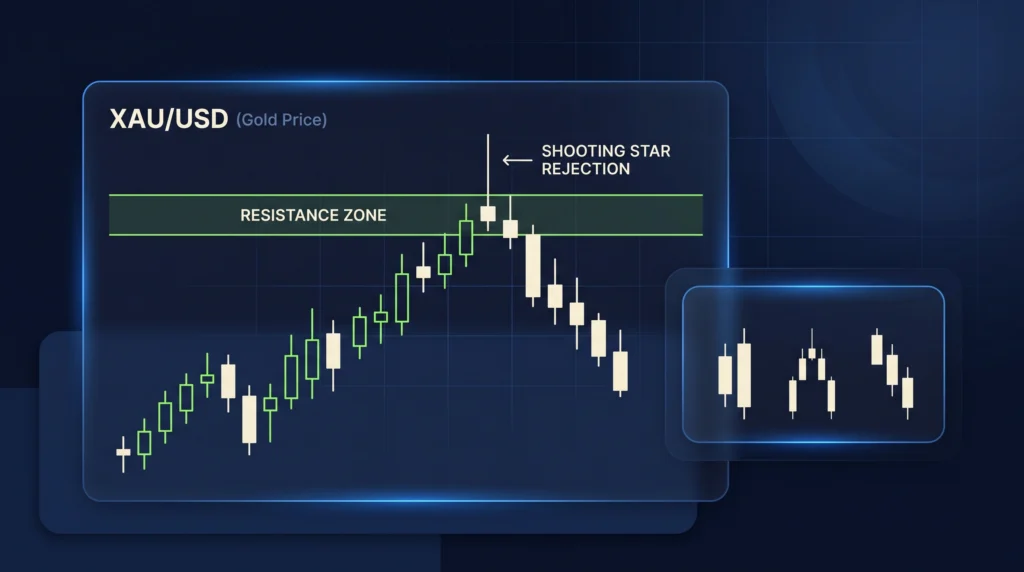
Bearish reversal patterns may indicate that an advancing gold market is losing momentum as sellers become more active. Their relevance tends to increase near resistance, after an extended rally, and when bearish follow-through develops.
Shooting Star and Hanging Man
A shooting star has a small body near the low and a long upper wick after an uptrend. It may signal rejection and a potential bearish reversal, especially near resistance or after an accelerated rise.
A hanging man shares the hammer’s shape but appears near the top of an uptrend. Its long lower wick shows that sellers temporarily gained control. Because price recovered before the close, traders generally seek a bearish candle afterward to confirm that selling pressure is returning.
Bearish Engulfing and Dark Cloud Cover
A bearish engulfing pattern forms when a bearish candle’s body covers the prior bullish body. After a mature advance near resistance, it may mark a price reversal. A larger second candle may indicate a stronger shift toward sellers.
Dark cloud cover begins with a bullish candle, followed by a bearish candle that closes below the midpoint of the first body. A deeper close implies more decisive bearish price action. Still, a close below nearby support provides better confirmation than pattern shape alone.
Evening Star and Evening Doji Star
An evening star starts with a strong bullish candle, followed by a small body and a bearish candle that closes well into the first range. An evening doji star uses a doji in the middle.
These formations may appear at the end of an uptrend. Yet inside a strong breakout with no nearby resistance, they may only represent a pause.
Bearish Harami and Bearish Harami Cross
A bearish harami contains a small second candle within the body of a long bullish candle. A bearish harami cross uses a doji as the second candle. Both show that upward momentum has contracted.
Because the second candle is small, the signal is tentative. A break below the pattern low or a bearish close beneath short-term support can provide additional evidence. Without confirmation, price may resume the bullish trend.
Three Black Crows, Gravestone Doji, Tweezer Top
Three black crows are three consecutive bearish candles with relatively strong closes. They may signal a powerful reversal after a prolonged rise, though late entry can be risky if price has already fallen into support.
A gravestone doji opens and closes near the low after rejecting higher prices. A tweezer top consists of two candles that fail near a similar high. Bearish reversal patterns appear more credible when these formations align with weakening momentum and a clear resistance level.
Kicker, Abandoned Baby, Island Reversal
A bearish kicker involves an abrupt shift from a bullish candle to a strong bearish candle, often with little overlap. An abandoned baby contains a separated doji between directional candles, while an island reversal involves a group of prices isolated by gaps.
These patterns may suggest a strong reversal, but true gaps are less common in spot gold. They may be easier to observe in futures, ETFs, or session-based charts, so confirm instrument-specific pricing.
Continuation Candlestick Patterns for Gold Trends
Continuation formations represent temporary consolidation within an established market move. Traders often use them to identify possible trend-following entries after price confirms a breakout from the pause.
Rising Three Methods and Falling Three Methods
Rising three methods begin with a strong bullish candle, followed by several smaller candles that remain within or near its range, then another bullish breakout candle. Falling three methods use the opposite structure in a bearish trend.
The smaller candles represent controlled consolidation rather than immediate reversal. Traders may enter after the final candlestick closes beyond the consolidation, provided the broader trend remains intact. A break against the first impulse candle may invalidate the continuation view.
Inside Bar, Outside Bar, Marubozu, Spinning Top
An inside bar has a range contained by the previous candle. It shows compression and can precede continuation or reversal. An outside bar exceeds both the prior high and low, signaling expansion. Direction depends on the close and surrounding structure.
A marubozu candle has little or no wick and reflects one-sided control. A spinning top has a small body with wicks on both sides, showing indecision. Patterns may be interpreted as follows:
- Inside bar with trend: possible breakout continuation.
- Outside bar at a key zone: possible reversal or volatility expansion.
- Marubozu after consolidation: strong directional participation.
- Spinning top after an extended move: possible loss of momentum.
Advanced Reversal and Chart Patterns for Gold
Advanced patterns combine candlestick behavior with broader sequences of highs, lows, gaps, and structural breaks. Because interpretation can vary, traders should define objective confirmation and invalidation rules before using these setups.
Hook Reversal, San-Ku Three Gaps, Sushi Roll
A hook reversal makes a new extreme but closes within the previous range, showing failed continuation. San-Ku three gaps describes three gaps during an extended move and is usually treated as exhaustion.
A sushi roll reversal uses a cluster of candles: an initial narrow range followed by a wider range that engulfs it. These setups are less standardized than common candlestick formations, so traders should define exact rules before testing them.
Head and Shoulders, Double Tops, Double Bottoms
Head and shoulders is a reversal chart structure with three peaks, where the middle peak is highest. A neckline break may confirm weakening bullish control. An inverse version can signal a possible bullish reversal after a decline.
Double tops and double bottoms show two failed attempts at a similar price area. Confirmation usually comes from a break of the intervening swing point, not merely the second touch. Candlestick signals around the second peak or trough can refine timing but should not replace structural confirmation.
Triple Tops, Triple Bottoms, Quasimodo Pattern
Triple tops and bottoms add a third test of resistance or support. Multiple tests can validate a zone, but they can also weaken it as resting orders are absorbed. Traders should watch how price leaves the area.
A Quasimodo pattern includes an irregular sequence of highs and lows that breaks prior structure before retesting an origin zone. It can help identify reversal points, yet naming conventions vary. Clear rules and historical testing are essential before including it in trading strategies.
Gold Entry Signals, Indicator Confirmation, Risk Management
A complete trade setup should combine price-action confirmation with entry criteria, stop placement, position sizing, and a realistic profit target. Indicators may support the analysis, but risk management remains essential when trading volatile or leveraged gold instruments.
RSI, MACD, Stochastic Confirmation
The relative strength index, MACD, and stochastic oscillator can help evaluate momentum. Divergence may suggest that price is making a new extreme while momentum is not, which can support a potential reversal thesis. Overbought and oversold readings alone are not entry signals because strong trends can remain stretched.
For a practical overview of commonly used tools, see best indicators for gold trading. Indicator settings should match the timeframe and be tested rather than selected only because they fit recent price action.
Moving Averages, Bollinger Bands, Parabolic SAR, Supertrend
Moving averages can define trend direction and dynamic support or resistance. Bollinger Bands show volatility, while Parabolic SAR and Supertrend track directional movement. Each reacts differently to ranges and fast reversals.
Avoid stacking several indicators that measure the same information. A cleaner process uses one trend filter, one momentum tool, and price action confirmation. More indicators do not automatically improve reliability.
Long and Short Entry Rules after Pattern Confirmation
A disciplined entry plan defines what must happen before risk is accepted.
For a long setup, a trader may require a bullish pattern at support, a close above the pattern high, and sufficient room before resistance. For a short setup, the trader may seek a bearish pattern at resistance, a confirming close below the pattern low, and a clear downside target.
Common entry methods include:
- Enter after confirmation candle close.
- Place a stop order beyond pattern high or low.
- Wait for a pullback toward broken structure.
- Skip entry when spread or slippage materially changes risk-reward.
Stop-Loss, Take-Profit, Risk-Reward, False Signal Control
A stop-loss should sit where the trade idea is invalidated, not at an arbitrary distance. For a bullish setup, that may be below the reversal low. For a bearish setup, it may be above the rejection high. Wider stops require smaller position sizes.
Risk-Reward Ratio = Potential Profit / Potential Loss. A setup with attractive pattern quality can still be unsuitable if the next support or resistance leaves little room for profit. Traders should also account for spread, commission, overnight swaps, and possible slippage.
Gold CFDs involve leverage, which can magnify gains and losses. Required Margin equals Trade Size divided by Leverage, but brokers may apply instrument-specific margin rules. Sudden volatility can lead to rapid losses or margin calls. No reversal indicators remove this risk, and past pattern performance does not guarantee future results.
FAQ
Which Candlestick Pattern Gives Strongest Gold Reversal Signal?
No single candlestick reversal pattern is consistently strongest. Engulfing formations, morning or evening stars, and rejection candles may become more useful when they appear after an extended move at a major support or resistance level. Confirmation from market structure, momentum, and a decisive close can improve confidence, but every setup can fail depending on liquidity, news, and volatility.
What Is Three-Candle Reversal Strategy for Gold Trading?
A three-candle reversal strategy usually looks for an impulse candle, a smaller indecision candle, and a third candle that closes strongly in the opposite direction. Morning star and evening star formations are common examples. Traders generally assess location, wait for completion, and place risk beyond the structure. The pattern may suggest reversal, but it should not be traded without defined invalidation and position sizing.
Does Doji Signal Reversal or Continuation in Gold Trading?
A doji signals indecision because opening and closing prices are close together. It can precede either reversal or continuation. At the top of an uptrend near resistance, a doji followed by a bearish close may support a bearish view. Within consolidation during a strong trend, it may simply reflect a pause. Context and the next candle are more important than the doji alone.
Are Reversal and Continuation Patterns Same for Gold, Forex, Stocks?
Many candle shapes are interpreted similarly across gold, forex, and stocks, but market structure differs. Gold responds strongly to macroeconomic news and currency conditions, stocks have exchange hours and company-specific gaps, and currency markets trade across global sessions. Pattern logic may transfer, but traders should adjust for volatility, liquidity, spread behavior, and instrument-specific execution before using the same rules.
Which Indicator Works Best for Gold Candlestick Entry Signals?
There is no universally best indicator for gold entries. A trend filter such as a moving average, a momentum tool such as RSI or MACD, and support or resistance analysis can complement candlestick formations. The best combination depends on timeframe and market conditions. Traders should avoid overfitting, test consistent rules, and remember that confirmation tools can reduce uncertainty but cannot eliminate trading risk.