Crypto Trading Strategies: Trend, Range, Breakout, and Position Approaches


Crypto trading strategies are structured descriptions of how market participants interpret price behavior in the cryptocurrency market. Because digital assets such as Bitcoin trade around the clock, price movements often appear in directional phases, sideways consolidations, and transitional moments between the two. Each phase has historically been associated with a distinct family of approaches, which is why crypto trading is commonly discussed in categories.
This educational overview describes four categories used by market participants: trend, range, breakout, and position approaches. The article defines each category, outlines commonly discussed indicators, compares the approaches, and reviews shared risks and backtesting limits. The content is informational, is not investment advice, and notes that past performance does not guarantee future results.
Key Takeaways
- Trend approach: Trend trading is described as participation in sustained upward or downward price movement, often interpreted through market structure and moving averages.
- Range approach: Range trading is associated with sideways markets, where price oscillates between support and resistance boundaries.
- Breakout approach: Breakout trading centers on price leaving a consolidation area, a transitional event that can occur in either direction.
- Position approach: Position trading is defined by a holding horizon of weeks to months rather than by one specific analytical technique.
- Closing note: Strategy behavior is typically tied to prevailing market conditions, and no approach guarantees outcomes. Losses may exceed initial expectations.
What Are Crypto Trading Strategies
A trading strategy is a conceptual framework, not a promise of results. This section defines the term in neutral language and then describes how strategies are commonly grouped and how prevailing conditions are said to influence their behavior. The aim is to build a shared vocabulary before individual approaches are examined.
A trading strategy is a structured way of describing how market participants interpret and respond to price behavior. In simple terms, a strategy links observations, such as price direction or volume, to a consistent analytical framework. Crypto trading strategies are therefore interpretive frameworks and carry no guarantee of outcomes.
Active and Passive Strategy Families
Market commentary usually splits cryptocurrency trading strategies into active and passive families. Active approaches include day trading, swing trading, scalping, and trend following. Passive approaches include long-term holding, dollar-cost averaging, and copy trading. The families differ mainly in time involvement and analytical intensity.
| Family | Common examples | Time involvement | Analytical intensity |
| Active | Day trading, swing trading, scalping, trend following | Frequent monitoring | Higher, with regular chart analysis |
| Passive | Long-term holding, dollar-cost averaging, copy trading | Infrequent monitoring | Lower, with limited ongoing analysis |
Scalping is a very short-term style in which a scalper may hold a position for seconds or minutes, as Investopedia describes. Day trading and intraday trading keep positions within a single session. Swing traders often hold across several days. Buying and holding sits at the opposite end of the time spectrum.
How Market Conditions Influence Strategy Behavior
Analysts commonly describe three phases: trending, ranging, and transitional. Trending phases show sustained direction, ranging phases show repeated oscillation between boundaries, and transitional phases mark the shift between the two. Different strategies are discussed in relation to each phase, though the link is descriptive.
Market conditions are typically identified retrospectively, because a phase is easier to label after it has occurred. Classification frameworks, such as trend or range labels, are interpretive tools rather than forecasts. The impact of market volatility can also change a phase quickly, which is one reason labels are often debated.
Trend Trading Strategy
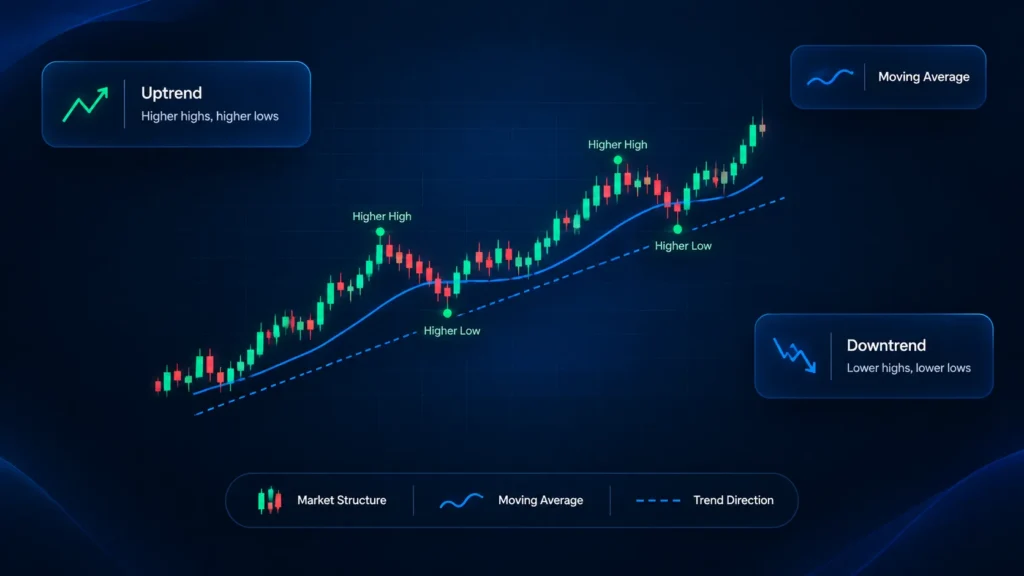
Trend trading is one of the most widely discussed crypto strategy families. This section introduces the approach, explains how market structure is read, reviews related indicators, and outlines balanced strengths and limitations. Every description is conceptual and does not constitute a signal or an instruction to act.
Trend following is built on the observation that prices sometimes move directionally for extended periods. A trader following this approach identifies sustained upward or downward movement and participates in the middle portion of a move. This style is often called trend trading, and it is generally described as direction-focused.
Uptrends, Downtrends, and Market Structure
Market structure is commonly read through sequences of swing points. An uptrend is described as a series of higher highs and higher lows, while a downtrend is described as lower highs and lower lows. Sideways phases show neither pattern clearly. These labels summarize past price action rather than predict future movement.
The phrase “the trend is your friend” is frequently repeated in market commentary. In descriptive terms, the saying reflects the observation that price momentum can persist. It is not a predictive rule, because trends can end without warning, and commentators generally treat the phrase as a heuristic rather than evidence.
Indicators Commonly Associated with Trend Following
A technical indicator is a calculation based on price or volume that is designed to summarize market behavior. Commentators often mention four tools alongside trend approaches, each with a different measurement purpose. For wider context, see this overview of crypto technical analysis.
- Moving average: A moving average smooths price data over a set period, such as the 50-day and 200-day simple moving averages. Commentators often read the slope as a rough indication of direction.
- MACD: Moving Average Convergence Divergence compares two exponential averages and is often described as a gauge of momentum.
- ADX: The Average Directional Index measures trend strength without indicating direction.
- Bollinger Bands: These bands plot volatility around a moving average and are often described as showing relative price extremes.
A moving average crossover occurs when a shorter average crosses a longer one. Market commentary describes it as a possible change in momentum, not as an entry or exit signal. Related tools such as Parabolic SAR are likewise described as trend-following indicators with interpretive, not instructional, roles.
Strengths and Limitations of Trend Trading
Trend trading may align with sustained directional moves, which historically have produced some of the largest price swings in the cryptocurrency market. Participation in the middle of a move is often described as less dependent on predicting exact turning points. These observations carry no performance implications.
The main limitation is susceptibility to whipsaws, where price reverses shortly after an indicator appears to confirm direction. In choppy, non-directional conditions, false signals may appear more often. Trend trading may also involve giving back part of a gain when a trend ends, so outcomes in some conditions can differ widely.
Range Trading Strategy
Range trading is the sideways counterpart to trend following. This section explains the approach, defines its boundaries, describes oscillators such as the Relative Strength Index, and reviews limitations. The wording remains descriptive, and no level or reading is presented as an instruction to place an order.
Range trading is associated with sideways markets, where price repeatedly oscillates between defined upper and lower boundaries. The approach is generally described as boundary-focused rather than direction-focused. A ranging market is not necessarily low in volatility, because sharp price swings can occur inside a range without producing a lasting trend.
Support and Resistance as Range Boundaries
Support and resistance are price areas where buying or selling pressure has historically slowed or reversed a move. Support is the lower boundary and resistance is the upper boundary. Repeated tests of a level are commonly interpreted as evidence that market participants regard that area as significant.
Technical analysis literature also describes consolidation patterns such as rectangles and triangles, which show price compressing between boundaries. A rectangle features roughly horizontal boundaries, while a triangle features converging ones. These patterns are descriptive labels. Supply and demand dynamics near the boundaries are what analysts typically try to interpret.
Overbought and Oversold Conditions
The Relative Strength Index (RSI) is a momentum oscillator, introduced by J. Welles Wilder, that scales recent price changes from 0 to 100. Investopedia explains that readings above 70 are conventionally labeled overbought and readings below 30 oversold. In range contexts, commentators describe these readings as signs of possible stretched movement.
A widely discussed caveat is that overbought or oversold readings can persist during strong directional moves. An RSI reading above 70 does not mean price must fall, and a reading below 30 does not mean price must rise. For this reason, oscillators are usually described as interpretive context rather than standalone indications.
Strengths and Limitations of Range Trading
Range trading may fit markets with repeated boundary interactions, since defined levels provide a visible reference for analysis. Some commentators note that the approach concentrates on a bounded area, which can make the framework easy to describe. These observations are descriptive and do not suggest particular outcomes.
The central limitation commonly cited is that ranges eventually end. Breakout risk is inherent to the approach, because price may move through a boundary and continue in one direction. Boundaries can also shift or become unclear, and readings in a range can be revised in hindsight, which makes outcomes difficult to characterize.
Breakout Trading Strategy
Breakout trading focuses on transitions, the moments when a consolidation phase gives way to movement. This section introduces the approach, describes how breakouts form, discusses the interpretive role of volume, and explains false breakouts. All descriptions are conceptual and none is intended as a setup.
Breakout trading centers on price leaving a consolidation area, together with the release of accumulated buying or selling pressure. Breakouts are transitional events that can occur in either direction: an upward move through resistance is a breakout, and a downward move through support is a breakdown. Both are discussed in market commentary.
How Breakouts Form in Consolidation Phases
Commentators describe a sequence in which price compresses within a range while liquidity, meaning resting orders, accumulates near the boundaries. Eventually price moves through a level. Categories mentioned in market commentary include continuation and reversal pattern breakouts, moving average breaks, and moves to new highs or lows.
A consolidation phase is sometimes compared to a coiled spring, an analogy used to describe how narrowing price ranges may precede larger moves. The analogy is illustrative only. Narrow ranges do not always produce a breakout, and direction cannot be inferred from compression alone. Some participants follow crypto trading signals from third parties, which carry their own limitations.
Trading Volume and Breakout Context
Trading volume measures how many units of an asset change hands in a period. In breakout analysis, expanded volume is often discussed as context for price moves beyond a level, because it may indicate broader participation. The idea is descriptive and is widely repeated in technical analysis education.
Volume is an interpretive input, not a guarantee of breakout validity. Large volume can accompany moves that later reverse, and low volume can accompany moves that continue. Because no reliable failure rate applies across all markets, claims about how often volume-supported breakouts succeed are generally treated with caution.
False Breakouts and Fakeouts
A false breakout, or fakeout, occurs when price moves through a level but then reverses back inside the prior range. Liquidity-driven moves can contribute: orders clustered beyond a level may be triggered, briefly pushing price through before it returns. Analysts often describe this as a short-lived excursion beyond the boundary.
A “retest” is the idea that price may return to a broken level to test it from the other side. In technical analysis discussions, a retest is interpreted as one way participants evaluate whether a breakout has held. Crypto markets are sometimes discussed as prone to engineered moves, though this view is debated and difficult to verify.
Position Trading Strategy
Position trading is defined by its time horizon, which distinguishes it from the other three categories. This section introduces the approach, explains typical holding periods and analytical focus, clarifies its relationship with trend following, and reviews trade-offs. Descriptions remain educational and non-promissory throughout.
Position trading is the longest-horizon active approach, with positions commonly held for weeks to months. It is defined by time frame and perspective, not by a specific entry technique. A position trader may apply trend, range, or fundamental frameworks, which is why the label describes duration rather than method.
Holding Horizons and Analytical Focus
Position trading is generally characterized by less frequent decision-making and a broader analytical focus. Commentators describe a mix of fundamental analysis, such as a crypto project’s technology and adoption, macro conditions such as interest rates, and technical context on weekly or monthly charts. Short-term price fluctuations receive less emphasis.
Holding positions for longer periods changes the character of analysis. Instead of reacting to intraday moves, the approach considers multi-week developments in the wider financial market. Position size and risk appetite are treated as part of the overall framework, though each market participant’s circumstances differ, and none of this is guidance.
Relationship Between Position Trading and Trend Following
Trend following describes a directional methodology, while position trading describes a holding horizon. The two terms are frequently treated as synonyms in competing articles, but they answer different questions: one asks how direction is read, and the other asks how long a position is held. The distinction is conceptual and often blurred in practice.
They overlap because long holding periods often suit sustained trends, and trend followers frequently hold positions for extended periods. They diverge because a swing trader can follow a trend over days, and a position trader can apply a non-trend framework such as a fundamental thesis. Overlap is common, but it is not definitional.
Strengths and Limitations of Position Trading
Commonly cited advantages include reduced screen time and lower sensitivity to intraday noise, since shorter-term price swings matter less over a longer horizon. Some participants describe a calmer analytical rhythm. These characteristics are descriptive and do not imply that any outcome is more likely.
The main trade-off is prolonged exposure to reversals and macro shocks during extended holds. Regulatory announcements, exchange failures, or sharp market-wide declines can occur while a position remains open. Longer holds may also tie up capital, so outcomes vary, and losses may exceed initial expectations.
Comparing Four Approaches
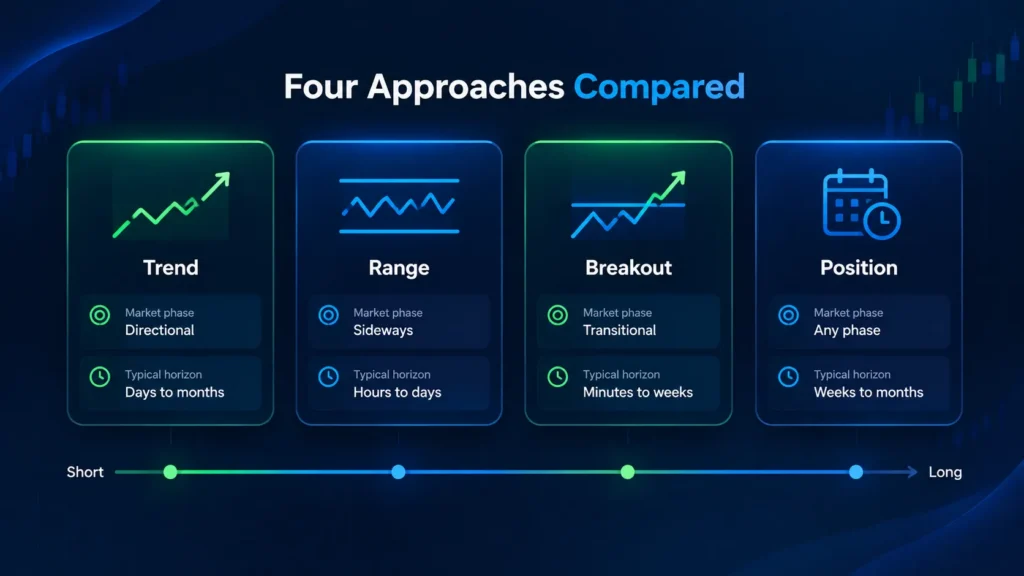
Comparing the four approaches side by side clarifies how they differ in market phase, horizon, and analytical focus. This section presents a descriptive table and then discusses conditions and shared risks. The comparison reports observed characteristics, and it contains no ratings, rankings, or recommendations.
| Approach | Market phase typically discussed | Typical horizon | Analytical focus | Commonly discussed limitations |
| Trend | Directional | Days to months | Market structure, moving averages, MACD, ADX | Whipsaws in choppy conditions |
| Range | Sideways | Hours to days | Support and resistance, RSI | Ranges end; breakout risk |
| Breakout | Transitional | Minutes to weeks | Consolidation patterns, volume | False breakouts and fakeouts |
| Position | Any, over long periods | Weeks to months | Fundamentals, macro, higher-time-frame charts | Prolonged exposure to reversals |
Market Conditions, Time Horizons, and Analytical Focus
Trend approaches are generally described in relation to directional phases, range approaches in relation to sideways phases, and breakout approaches in relation to transitions. Position trading spans conditions because it is defined by horizon. Each association is an observed characteristic, not guidance on matching a strategy to a market.
Time horizons and toolsets also differ. Scalping and other short-term strategies rely on short-term price data and fast execution, while position trading draws on slower information. Technical analysis dominates shorter horizons, whereas fundamental analysis plays a larger role in longer ones. These tendencies vary between market participants.
Shared Risks, Costs, and Liquidity Constraints
All four approaches share exposure to the conditions of the crypto market. Commonly discussed cross-cutting considerations include the following. For a deeper treatment, see this overview of crypto trading risk management.
- High volatility: Cryptocurrency prices can move sharply within hours, and volatile markets can widen losses quickly.
- Fees and slippage: Crypto exchange fees and slippage, the gap between expected and executed price, reduce net results.
- Liquidity constraints: Smaller tokens often have thin order books, which can make exits difficult.
- Funding costs: Derivatives and contract for difference (CFD) products may carry financing charges, and leverage can magnify losses.
- Regulatory uncertainty: The European Securities and Markets Authority has warned that crypto-assets are high-risk and that consumers may lose all invested money.
Risk management concepts such as position sizing and stop-loss orders are widely discussed tools that exist in this context. They are described here, not recommended, and they cannot remove risk. Gaps in price can cause a stop-loss order to execute at a worse level than intended.
Backtesting and Evidence Limitations
Backtesting is the practice of evaluating a strategy against historical data to see how its rules would have performed. Investopedia describes backtesting as a common step in strategy research. Educational providers such as QuantInsti and its Quantra platform discuss backtesting using Python, which is widely used for this analysis.
Commonly discussed limitations include:
- Overfitting: A strategy tuned too closely to past data may fail on new data.
- Survivorship bias: Datasets that omit delisted tokens can overstate results.
- Changing market regimes: Conditions that existed historically may not recur.
- Transaction costs: Fees, spreads, and slippage are sometimes underestimated.
Historical results are widely regarded as non-indicative of future performance. Paper trading and live trading can show different outcomes from a backtest because execution conditions differ. Backtesting is therefore treated as one input to analysis and not as proof that a strategy works.
FAQ
How Does Trend Trading Differ from Position Trading?
Trend trading describes a directional methodology, while position trading describes a holding horizon of weeks to months. The two overlap because long holds often coincide with sustained trends, so the terms are frequently used interchangeably in market commentary. They remain distinct, since a position can be held without following a trend.
Which Market Conditions Are Typically Associated with Range Trading?
Range trading is typically associated with sideways, consolidation-heavy phases, where price oscillates between identifiable boundaries. These associations are retrospective observations, because a range is usually recognized only after several boundary tests. They are not predictions, and a range may end at any time.
What Does False Breakout Mean in Crypto Markets?
A false breakout is a price move through a level that reverses back inside the prior range. In crypto markets, clustered orders and thinner liquidity near key levels are sometimes discussed as contributing factors. This explanation is hedged, as the causes of individual moves are difficult to verify.
Do Crypto Trading Strategies Actually Work?
Outcomes vary, and evidence is mixed. Performance depends heavily on market conditions, costs, and discipline, and no strategy guarantees results. As noted in the backtesting section, historical tests have important limitations, so past performance does not guarantee future results.
Can Trend, Range, and Breakout Approaches Be Combined?
Some market participants describe hybrid frameworks that draw on more than one approach. Combination is an individual practice area and not an established prescription, and no hybrid is presented here as a recommendation. Each added element can also introduce its own limitations.
What Role Does Trading Volume Play in Breakout Analysis?
Volume is often discussed as context for breakouts, since expanded volume may indicate broader participation in a move beyond a level. It is one descriptive input among several and not a standalone confirmation. Breakouts with high volume can still reverse, and low-volume ones can still continue.