Crypto Trading Chart Patterns: Reversal and Continuation Formations


Crypto trading chart patterns are recognizable shapes that price movements form on a cryptocurrency chart. Within technical analysis, a chart pattern is commonly placed into one of two families: reversal formations, often associated with potential trend changes, and continuation formations, typically linked to pauses inside an existing trend. Many beginners first meet these ideas while learning about crypto trading.
This article takes a descriptive, educational look at how crypto chart patterns are defined, how analysts commonly interpret them, and which limitations apply. No formation guarantees an outcome, and trading involves risk, including the possibility that losses may exceed initial expectations. The content is general market commentary and does not constitute financial or investment advice.
Key Takeaways
- Chart patterns are conventionally divided into reversal, continuation, and sometimes bilateral groups.
- Classification depends on the market trend context in which the formation appears.
- Head and shoulders, double and triple tops and bottoms, and wedges are frequently described reversal formations.
- Reversal formations are commonly associated with potential exhaustion of an existing trend.
- Flags, pennants, triangles, rectangles, and cup and handle are typically described as continuation formations.
- Continuation formations are often interpreted as consolidation within an ongoing trend, not as guarantees of future direction.
What Are Crypto Chart Patterns and How Do They Work
Crypto chart patterns translate price history into geometric shapes that analysts classify and discuss. The sections below cover their origins, the psychology attributed to them, their typical mechanics, and the role of volume.
Definition and Origins in Technical Analysis
A chart pattern is a recognizable shape formed by price movements on a price chart. Chart pattern analysis originated in classical technical analysis, developed for stock and commodity markets, before being applied to cryptocurrency through what is now called crypto technical analysis. Most crypto charts use candlestick formats, where each candle records the open, high, low, and close.
| Term | Simple Meaning |
| Trend | The general direction of price over a period |
| Support and resistance | Price zones where movement has repeatedly paused or turned |
| Consolidation | A sideways phase with a narrowing or flat price range |
| Breakout | A move beyond a pattern boundary |
| Neckline | A reference line connecting key points in certain formations |
| Flagpole | The sharp move that precedes a flag or pennant |
Academic research has examined these shapes. A Journal of Finance study by MIT and Yale researchers applied computational pattern recognition to U.S. stocks from 1962 to 1996. It reported that several formations, including head and shoulders and double bottoms, may carry some incremental information.
How Chart Patterns Reflect Market Psychology
Analysts often describe a chart pattern as a visual record of the balance between buyers and sellers. Market psychology, including fear, optimism, and hesitation, is believed by some to leave repeated shapes on a chart. Behavioral economics research on crowd behavior is sometimes cited as a conceptual backdrop, although it does not prove that any specific shape predicts outcomes.
Accumulation describes a phase when an asset is gradually acquired by larger participants, while distribution describes a gradual reduction of holdings. Repeated failed attempts to move through a price level may be read as pressure from the opposing side. Wyckoff accumulation and distribution schematics are sometimes used to describe the same phenomena in a more structured way.
Trend, Consolidation, and Breakout Mechanics
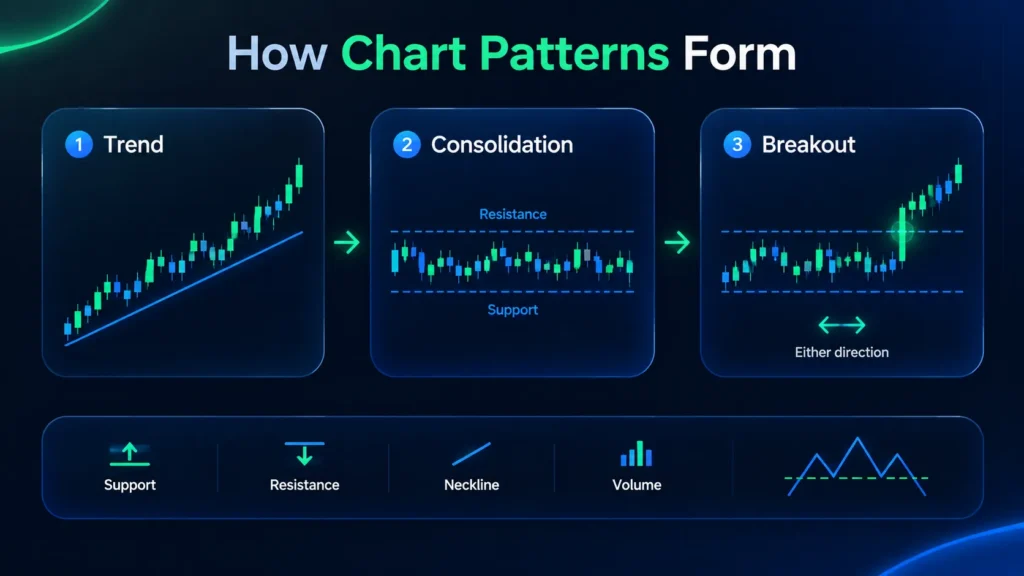
A typical chart pattern lifecycle has three stages: an established market trend, a consolidation or shaping phase, and a breakout commonly interpreted as pattern completion. For example, a hypothetical Bitcoin price might range between 60,000 and 65,000 for several weeks before closing beyond one boundary. Such a move is often described as a breakout from the range.
Breakouts can occur in either direction, and the shape alone does not determine where price travels next. A move beyond a boundary may extend, stall, or reverse. Momentum, market liquidity, and wider conditions are frequently cited as extra context, though none removes uncertainty. Probability, not certainty, is the usual framing in analytical commentary.
Role of Volume and Pattern Confirmation
Trading volume is traditionally used as supporting context for pattern development. Declining volume during consolidation and elevated volume around a breakout are often cited characteristics. This volume analysis is descriptive context rather than a reliable signal, because crypto volume data can differ across exchanges and, in some cases, may include inflated figures.
Many analysts treat a breakout through a pattern boundary as a common criterion for considering a formation complete. Until that point, the structure may remain unfinished or may transform into a different formation. Confirmation is therefore described as a matter of interpretation rather than a fixed standard, and it varies between analysts and platforms.
Popular Chart Patterns: Reversal Formations
Reversal formations are chart patterns commonly associated with a possible change in an existing trend. The table below works as a short cheat sheet for the formations discussed in this article, and the subsections explain the reversal group.
| Formation | Typical Geometry | Common Interpretation |
| Head and shoulders | Three peaks, higher central peak, neckline | Possible bullish-to-bearish shift |
| Double top/bottom | Two roughly equal peaks or troughs | Possible trend exhaustion |
| Rising/falling wedge | Converging sloping trendlines | Weakening momentum; classification varies |
| Flag/pennant | Flagpole plus small consolidation | Pause within a trend |
| Ascending/descending triangle | Flat boundary with rising lows or falling highs | Continuation, direction can vary |
| Cup and handle | Rounded basin plus small drift | Longer-term bullish continuation |
Head and Shoulders and Its Inverse Variant
The head and shoulders pattern consists of three peaks, with a higher central peak (the head) flanked by two lower peaks (the shoulders), connected by a neckline. It is commonly associated with a potential shift from bullish to bearish sentiment. The inverse head and shoulders mirrors this structure with three troughs and is associated with the opposite shift.
Head and shoulders typically develops after an extended trend, and it is among the most frequently cited formations in educational literature on crypto charts. Height, measured from the head to the neckline, is sometimes referenced by analysts to describe the scale of a formation. A neckline breach is generally treated as the point of completion.
Double and Triple Tops and Bottoms
A double top forms when price reaches two roughly equal peaks, while a double bottom forms with two roughly equal troughs. The shapes are often described as resembling the letters M and W. A triple top or triple bottom extends the structure with three touches of the same level.
Repeated failures to move through a level are sometimes viewed as signs of trend exhaustion. Related shapes such as the rounding bottom occasionally appear in classification lists and describe gradual shifts rather than sharp ones. Any bottom pattern remains an interpretation, since price may also resume the earlier trend after the second or third touch.
Rising and Falling Wedges
A wedge is formed by converging trendlines that slope upward (rising wedge) or downward (falling wedge). Wedges are commonly associated with weakening momentum, since the price range narrows as the formation develops. Divergence between price and momentum indicators is sometimes mentioned alongside this narrowing in analytical commentary.
Classification of the wedge varies. Some sources describe rising wedges as bearish and falling wedges as bullish, while others treat them as neutral patterns whose outcome depends on context. Because of this disagreement, the label attached to a wedge is best understood as one common interpretation among several, rather than a settled rule.
Bilateral Formations and Classification Nuances
Some formations, notably the symmetrical triangle, are classified as bilateral because they can resolve in either direction. Classification of any pattern depends on the preceding trend, the timeframe, and subsequent price behavior rather than on shape alone. A diamond pattern, for instance, is sometimes listed under reversal formations and sometimes treated separately.
Reversal and continuation labels describe common interpretations, not deterministic outcomes. The same triangle may be called a continuation pattern in one source and a neutral formation in another. Understanding this flexibility helps explain why published lists of crypto chart patterns rarely match one another line for line.
Continuation Formations in Crypto Chart Patterns
Continuation formations are chart patterns typically described as pauses within an ongoing trend. The shapes below are frequently listed in educational sources on crypto chart patterns.
Flags and Pennants
A bull flag or bear flag consists of a sharp directional move, the flagpole, followed by a small, gently sloping consolidation, the flag. A pennant is similar, but the consolidation forms a small symmetrical triangle. Both are commonly interpreted as a brief pause in an ongoing trend that may resume afterward.
In crypto markets, the flag pattern and pennant are frequently discussed because sharp directional moves occur often. Even so, a pause is not a promise of resumption, and either formation may resolve against the preceding direction. Pattern trading commentary therefore usually treats these shapes as context rather than as dependable predictors.
Ascending, Descending, and Symmetrical Triangles
An ascending triangle has flat resistance and higher lows, a descending triangle has flat support and lower highs, and a symmetrical triangle has two converging trendlines. Conventionally, the ascending form is linked to bullish interpretations and the descending form to bearish ones. Some analysts treat the symmetrical triangle as direction-neutral.
Breakout direction can vary, and triangles occasionally resolve against the expected direction. Analysts often note that the triangle’s narrowing range reflects falling volatility, which may precede a larger move in either direction in some market conditions. Such commentary describes tendencies, not outcomes.
Rectangles and Price Channels
A rectangle is a horizontal consolidation between parallel support and resistance lines, while a price channel is the diagonal equivalent. Both are generally described as pauses within a trend, with the trend potentially resuming after a boundary is crossed. The same shapes can also precede reversals, depending on broader context.
Cup and Handle
The cup and handle is a rounded, basin-like decline and recovery followed by a smaller downward drift called the handle. Educational sources typically describe it as a longer-term bullish continuation structure that often forms over extended periods. An inverted variant also appears in some classifications, mirroring the shape for bearish contexts.
Crypto-Specific Aspects: Timeframe, Volatility, and How Analysts Trade Crypto Chart Patterns
Cryptocurrency markets differ from traditional ones in several ways that affect how formations develop. This section describes volatility, timeframe, and liquidity as they relate to how analysts trade crypto chart patterns.
Volatility and 24/7 Crypto Markets
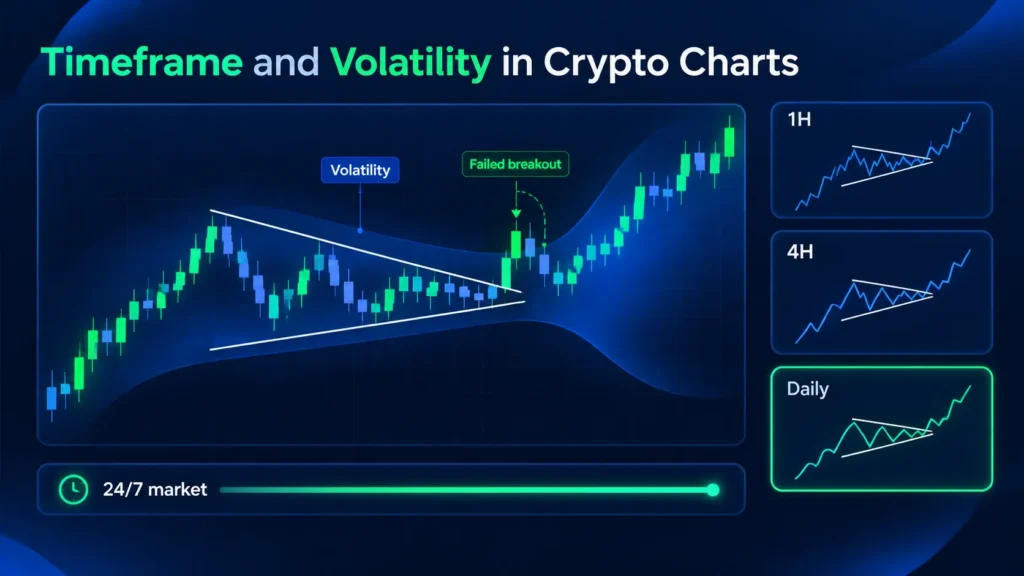
Cryptocurrency markets operate without scheduled sessions, so a chart pattern can form and break at any hour, including weekends. The absence of closing times changes how gaps appear and how quickly a breakout may unfold. Analysts often compare this with stock markets, where overnight gaps are more common.
Elevated volatility in the crypto market may produce more frequent false moves and sharper breakouts than traditional markets, according to some analysts. Volatile crypto assets can move several percent within minutes. Volatility therefore shapes how reliable any formation appears, and risk management considerations are usually discussed separately from pattern descriptions.
Timeframe Differences and Pattern Quality
The same formation can appear on timeframes ranging from one minute to weekly charts. Larger timeframes, such as 4-hour and daily charts, are often described as producing more statistically meaningful formations, because each candle summarizes more trading activity. This view is not universally accepted and remains debated among analysts.
Pattern appearance can differ across timeframes, and a bullish pattern on one chart may coexist with a bearish pattern on another. For this reason, multi-timeframe analysis and timeframe consistency are commonly emphasized in analytical commentary. Platforms with TradingView-powered charts allow the same asset to be viewed across many intervals.
Liquidity and Altcoin Charts
Market liquidity affects pattern clarity. Formations on high-liquidity pairs involving major coins, such as Bitcoin, are often described as cleaner, while low-liquidity altcoins can show distorted shapes, gaps, and sudden spikes. Some analysts treat patterns on illiquid assets with extra caution, since a small order can move price enough to alter a formation.
Chart Pattern Analysis: Reliability and Limitations of Breakout Signals
Chart pattern analysis has recognized limits, and educational sources generally present them alongside the formations themselves. This section covers failed breakouts, subjectivity, and the comparison with technical indicators.
Failed Breakouts and Fakeouts
A breakout from a formation does not always lead to a sustained move. Price can reverse after crossing a boundary, which is commonly described as a fakeout or failed breakout. Such outcomes are reported to be relatively frequent, particularly in volatile crypto markets, according to some analysts and trading communities.
Factors often mentioned in discussions of failed breakouts include:
- Low trading volume at the moment a boundary is crossed
- Thin liquidity on smaller crypto pairs
- Sudden news events that shift sentiment
- Leveraged positions being closed in bulk, which can amplify short-term moves
- Ambiguous boundaries that different analysts draw differently
Subjectivity in Pattern Identification
Pattern recognition involves interpretation. Different analysts may draw different boundaries, disagree on whether a formation exists, or see the same shape differently on separate platforms. The NBER working paper on technical analysis notes that geometric shapes in historical charts are open to subjective reading, which motivated attempts at automated detection.
Hindsight bias adds another concern: patterns are easier to see after price has moved than while it develops. Academic critics also point out that random price series can produce shapes resembling recognized formations. Artificial intelligence and algorithmic trading tools, including scanners on platforms such as altFINS, attempt to reduce this subjectivity, although automated detection has its own limitations.
Chart Patterns vs Technical Indicators
Chart patterns are direct readings of price structure, while technical indicators such as moving averages and oscillators are mathematical transformations of price data. Patterns are drawn by hand or detected by software, whereas indicators are calculated from fixed formulas. The two approaches describe the same price chart through different lenses.
Some market participants combine both approaches, while others rely on one. Discussions of the best indicator for crypto trading vary widely, with no single tool universally accepted. Overviews of crypto trading strategies generally describe patterns as one input among several. Neither approach removes uncertainty.
Risk Awareness and Compliance Notes
Cryptocurrency is a high-risk asset class, and leveraged products can magnify both gains and losses. Past performance does not guarantee future results, and an investment in any crypto asset may lose value quickly. Losses may exceed initial expectations, particularly when leverage is involved. Readers may wish to consult a licensed professional regarding personal circumstances.
FAQ
What Are Crypto Trading Chart Patterns?
Crypto trading chart patterns are recognizable formations created by price movement on cryptocurrency charts. They are commonly grouped into reversal, continuation, and bilateral categories. The grouping reflects how analysts interpret the surrounding market trend, so the same shape may be classified differently depending on the source and the context in which it appears.
How Do Reversal and Continuation Formations Differ?
Reversal formations are commonly associated with potential trend changes, while continuation formations are typically described as pauses within an existing trend. The distinction depends on the trend that precedes the shape. Exceptions are common, since a formation labeled as continuation can still resolve as a reversal, and the reverse can also occur.
Which Chart Patterns Appear Most Often in Crypto Markets?
Head and shoulders, double tops and bottoms, wedges, flags, pennants, triangles, and cup and handle are among the most frequently cited formations. Frequency of citation reflects popularity in educational material rather than measured statistical occurrence. Actual appearance varies by asset, timeframe, and market period, and no ranking is universally agreed upon.
Can Chart Patterns Predict Price Movements?
Not reliably. Patterns describe historical price structure and are sometimes interpreted as suggestive of future behavior, but no formation guarantees an outcome. Past performance does not guarantee future results, and price can move against any commonly cited interpretation. Research findings on pattern value are mixed and depend on the asset, period, and detection method.
Are Chart Patterns Reliable in Volatile Crypto Markets?
Reliability varies by pattern, timeframe, and market conditions. Volatility may increase the frequency of failed breakouts, according to some analysts, and low-liquidity assets can distort shapes further. Because identification is partly subjective, two analysts may reach different conclusions about the same chart, which limits how consistently reliability can be assessed.
Which Timeframes Show Chart Patterns Most Clearly?
Patterns can appear on any timeframe, from minutes to weekly charts. Higher timeframes are often described as producing more meaningful formations because each candle aggregates more activity. This view is not universally accepted, and some analysts argue that shorter intervals reveal useful structure too, depending on the asset and the market conditions.