Crypto Technical Analysis: Trends, Price Action, and Chart-Based Evaluation


Crypto technical analysis is a method of examining historical price movements, trading volume, and chart patterns to describe market behavior. In crypto trading, the method is often discussed because cryptocurrency markets operate around the clock, display high volatility, and show uneven liquidity across exchanges, while market sentiment can shift within hours.
Technical analysis differs from fundamental analysis, which studies project teams, token supply, and economic conditions rather than charts. This article covers trends, price action, chart types, indicators, patterns, and limitations in plain language for beginner traders. Past performance does not guarantee future results, and losses may exceed initial expectations in volatile markets.
Key Takeaways from Crypto Technical Analysis
- Technical analysis examines historical price movements, volume, and market structure.
- Trends can be classified as upward, downward, or sideways.
- Price action and candlestick patterns provide context for interpreting market behavior.
- Support, resistance, and chart patterns are interpretive tools, not fixed rules.
- Technical indicators measure different aspects of price behavior and may produce false signals.
- Cryptocurrency volatility, liquidity, and unexpected events limit forecasting reliability.
What Is Crypto Technical Analysis?
Crypto technical analysis is the study of historical price data, trading volume, and market structure on a price chart to describe how a cryptocurrency has behaved. Analysts convert past transactions into visual formats such as charts, then interpret recurring shapes and trends. Past movements are not assumed to guarantee future outcomes.
Core Principles of Technical Analysis
Technical analysis rests on three commonly cited principles: price history reflects available information, prices tend to move in trends, and market behavior often repeats because of trader psychology. According to Investopedia, the discipline evaluates statistical patterns in price and volume. The three principles describe market activity rather than guarantee results.
- Price history: Past prices are treated as a record of collective market decisions.
- Market trends: Prices are described as moving upward, downward, or sideways.
- Volume: Participation levels provide context for price changes.
- Behavioral patterns: Recurring reactions linked to psychology are examined.
Technical Analysis vs. Fundamental Analysis
Technical analysis evaluates chart-based price data, whereas fundamental analysis evaluates factors such as network activity, token supply, development teams, and macroeconomics. Both approaches describe a cryptocurrency from different angles in research. Some traders combine the two, while others rely on only one perspective, depending on time horizon and research style.
| Aspect | Technical Analysis | Fundamental Research |
| Primary data | Price, volume, and chart structure | Project documents, on-chain data, economic news |
| Analytical focus | Market behavior and structure | Factors associated with long-term value |
| Typical time horizon | Short to medium term | Medium to long term |
| Common limitation | Subjectivity and false signals | Data quality and delayed price reaction |
Why Technical Analysis Matters in Crypto Markets
Cryptocurrency exchanges operate 24 hours a day, so price charts typically lack the weekend or overnight closing gaps seen in stock charts. This continuous trading, together with sharp price swings and liquidity fragmented across platforms, can produce rapid price movement. Chart interpretation therefore must account for differing data between exchanges.
Sentiment, shaped by news, social media, and behavioral economics concepts such as fear and herd behavior, can alter the current price within minutes. European regulators, including ESMA, have warned that crypto assets are often highly risky and speculative, and retail investors may lose all invested money. Volatility therefore matters alongside direction.
Crypto Market Trends and Price Direction
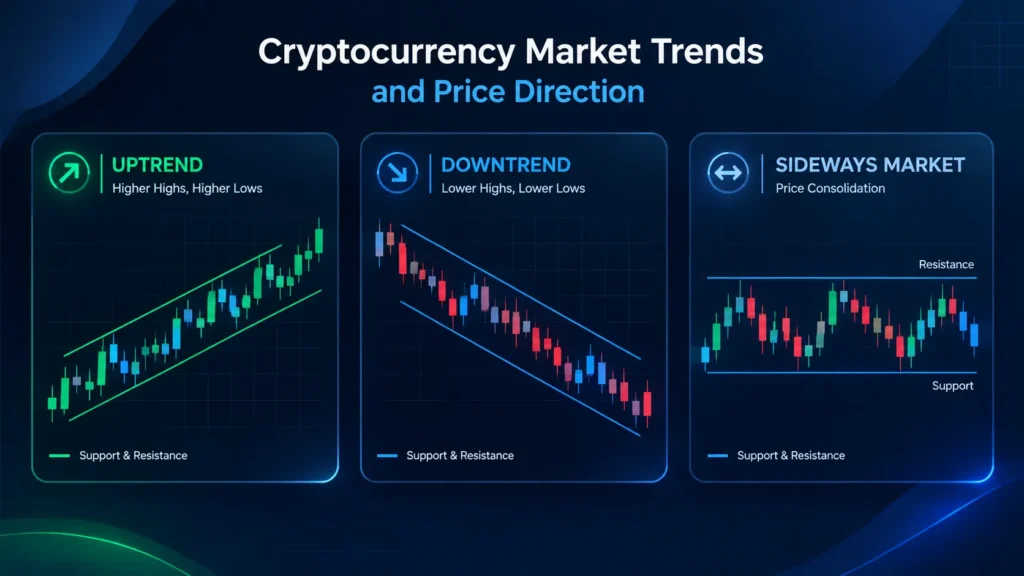
A market trend is a broad pattern of price movement over time, commonly described as upward, downward, or sideways. Analysts identify trends by examining historical highs, lows, and changes in market structure on a chart. Trends can weaken, pause, or reverse without warning, particularly in cryptocurrency markets with frequent sharp swings.
Uptrends, Downtrends, and Sideways Markets
An uptrend is typically described as a series of higher highs and higher lows, while a downtrend consists of lower highs and lower lows. A sideways market, also called consolidation, occurs when price oscillates within a horizontal range. For a hypothetical example, Bitcoin trading between 60,000 and 65,000 dollars for several weeks would often be labeled sideways.
Trendlines and Price Channels
A trendline connects significant lows in an uptrend or significant highs in a downtrend, while a parallel line drawn on the opposite side forms a price channel. Trendlines are interpretive, so different analysts may draw different lines on the same chart. A trendline break is often associated with weakening momentum rather than a confirmed change.
Support and Resistance Levels
Support and resistance describe price areas where buying or selling activity has historically concentrated. Support is a price level where declines have previously paused, while resistance is a level where advances have previously stalled. Round numbers such as 50,000 dollars often attract trader attention, yet these zones are not precise or permanent boundaries and can break after repeated tests.
Trend Reversals and Breakouts
A breakout is a movement beyond an established price range, while a reversal is a change in the prevailing direction. A false breakout occurs when price moves past a boundary briefly and then returns inside the range. Distinguishing a lasting change from short-term fluctuations is difficult, and confirmation is typically assessed only after the fact.
Price Action Analysis in Cryptocurrency Markets
Price action analysis studies price behavior directly, without relying exclusively on mathematical indicators. Analysts examine candle formations, swing points, momentum, and reactions around significant price areas to describe market behavior. Price action is commonly used to add context to indicator readings for beginner traders.
Candlestick Charts and OHLC Data
A candlestick chart displays open, high, low, and close (OHLC) values for each time period. The candle body spans the open and close, while upper and lower wicks show the extremes. A bullish candle closes above its open and a bearish candle closes below it. Wick length shows how far price moved away before returning.
Charting interfaces on a cryptocurrency exchange or on platforms such as YouHodler typically provide selectable timeframes. Because each candle summarizes a fixed interval, a one-hour candle covers sixty minutes of trading while a daily candle covers twenty-four hours, which changes how wicks and bodies are interpreted.
Common Candlestick Patterns
Common candlestick patterns include the doji, hammer, shooting star, bullish engulfing, and bearish engulfing formations, which Investopedia describes among widely recognized chart signals. Each pattern may reflect buying pressure, selling pressure, or indecision. No single candle reliably predicts future price movement, and significance depends on the surrounding trend and context.
- Doji: Open and close are nearly equal, often associated with indecision.
- Hammer: A small body with a long lower wick, sometimes linked to rejection of lower prices.
- Shooting star: A small body with a long upper wick, sometimes linked to rejection of higher prices.
- Bullish engulfing: A bullish candle whose body covers the previous bearish body.
- Bearish engulfing: A bearish candle whose body covers the previous bullish body.
Momentum, Volatility, and Market Structure
Momentum describes the speed and magnitude of price changes, while volatility describes how widely prices fluctuate. Expanding ranges and strong directional candles are often associated with active participation, whereas contracting ranges may indicate consolidation. Changes in the relationship between swing highs and swing lows can signal a shift in market structure, though interpretation remains subjective.
Trading Volume and Price Action
Volume represents market participation, meaning the number of units of a cryptocurrency traded during a period. A breakout accompanied by high volume is often interpreted as broader participation than a low-volume breakout, while declining volume during consolidation is common. Volume data can differ across fragmented exchanges, so a single platform may not represent total market activity.
Crypto Chart Patterns and Their Market Implications
Chart patterns are recurring visual formations that analysts use to describe possible continuation, reversal, or consolidation behavior. Resources on crypto trading chart patterns typically show these shapes on a chart. Patterns represent interpretations of past price behavior rather than reliable forecasts, and the same formation can resolve in either direction.
Continuation Patterns
Continuation patterns include flags, pennants, and ascending, descending, and symmetrical triangles. Flags and pennants are short consolidations after a sharp move, while triangles show converging highs and lows, and ascending versions often feature a flat upper boundary. These shapes may reflect a temporary pause within a broader trend, although the trend can also reverse after the formation completes.
Reversal Patterns
Reversal patterns include head and shoulders, inverse head and shoulders, double tops, and double bottoms. A head and shoulders formation shows three peaks with a higher middle peak, while a double top shows two failed attempts to exceed a price area. These formations can reflect changing market pressure, but incomplete shapes frequently fail.
Chart Pattern Reliability and False Signals
Pattern identification is subjective, since two analysts may draw different boundaries on the same chart. Incomplete formations, false breakouts, and timeframe selection can all change the interpretation. The same pattern may produce different outcomes across assets and market conditions, which is why chart patterns are commonly treated as descriptive context rather than rules.
Technical Indicators for Crypto Chart Evaluation
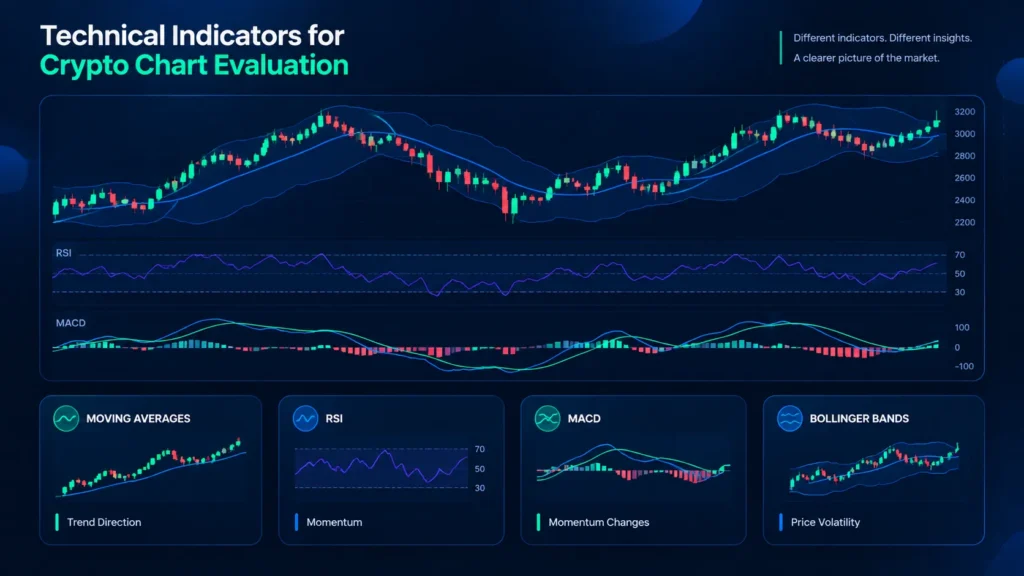
A technical indicator is a mathematical formula applied primarily to past prices and volume. Each indicator describes trend direction, momentum, range, or participation, and a guide to the best indicator for crypto trading typically notes that no single option is universal. Indicators provide analytical context rather than certainty about future outcomes.
| Indicator | Primary Aspect | Common Interpretation | Main Limitation |
| SMA and EMA | Trend direction | Slope and crossovers described as trend shifts | Lags recent price changes |
| RSI | Momentum | Readings from 0 to 100 | Extremes can persist in strong trends |
| MACD | Momentum and trend | Signal line crossovers | Less informative in sideways markets |
| Bands and ATR | Price variability | Band width and typical swing size | Does not show direction |
Moving Averages and Trend Identification
A moving average smooths price fluctuations by calculating the average price over a chosen number of periods. A simple moving average (SMA) weights all periods equally, while an exponential moving average (EMA) assigns greater weight to recent prices. Crossovers between shorter and longer averages are often associated with potential trend changes, though the calculation inherently lags behind recent price changes.
Relative Strength Index (RSI)
The Relative Strength Index (RSI), developed by J. Welles Wilder, is a momentum indicator measured on a scale from 0 to 100. Analysts often label conditions overbought or oversold using thresholds of 70 and 30. Extreme readings can persist during strong trends, so RSI alone does not establish a trend change. Momentum divergence between RSI and price may also be discussed.
Moving Average Convergence Divergence (MACD)
Moving Average Convergence Divergence (MACD) compares two exponential averages and plots a signal line and a histogram. Crossovers between the MACD line and signal line, and changes in histogram height, are often interpreted as shifts in momentum. Signals can lag price changes and become less informative in sideways markets.
Bollinger Bands and Average True Range
Bollinger Bands plot an upper and lower band around a 20-period average line, typically placed two standard deviations away. Band expansion is often associated with rising volatility, while contraction may reflect quieter conditions. Average True Range (ATR) measures the typical size of price swings and does not indicate direction, so ATR describes price variability rather than momentum.
Multi-Timeframe Analysis and Crypto Market Context
Timeframe selection changes how a price chart looks, because a one-minute chart and a weekly chart can show opposite directions for the same cryptocurrency. Multi-timeframe analysis compares short-term behavior with broader structure, and resources on the best timeframe for crypto trading generally note that different timeframes do not always agree.
Short-Term vs. Long-Term Chart Analysis
Intraday charts, such as 15-minute or one-hour views, show fine price detail but contain more market noise. Daily and weekly charts display longer-lasting trends with fewer random fluctuations. Short-term fluctuations can therefore differ from longer-term direction, and a bullish hourly move may sit inside a broader daily downtrend, according to common charting conventions.
Correlation Between Bitcoin and Altcoin Price Movements
Bitcoin, the largest digital currency, often influences broader cryptocurrency market conditions, and many altcoins have historically moved in the same direction as BTC. The strength of that relationship varies, however, and correlations can strengthen, weaken, or change during market stress. When Bitcoin declines sharply, many altcoins have often declined by larger percentages, although exceptions occur.
External Factors Affecting Technical Analysis
Several external developments can override chart-based expectations in cryptocurrency markets. Such developments can often create price changes that historical patterns do not capture. The categories below illustrate why chart interpretation is generally considered alongside broader market context, including macroeconomics, asset-specific news, and the operating conditions of each cryptocurrency exchange.
- Macroeconomic announcements: Interest rate decisions and inflation data can shift risk appetite.
- Regulatory developments: New rules or enforcement actions can change market access.
- Exchange disruptions: Outages, hacks, or delistings can interrupt normal trading.
- Liquidity changes: Reduced market depth can magnify price swings.
- Asset-specific events: Protocol upgrades or token unlocks can alter supply conditions.
Limitations and Risks of Crypto Technical Analysis
Some market participants use technical analysis to structure chart observations, yet chart-based evaluation cannot eliminate uncertainty in cryptocurrency markets. Rapid price swings, subjective interpretation, and unexpected events all limit forecasting reliability. A balanced assessment recognizes both the descriptive value and the constraints of chart reading.
Market Volatility and False Signals
Cryptocurrency prices can swing sharply within minutes, and thin liquidity or sudden liquidations can extend moves beyond levels that chart structure implied. False breakouts and stop-driven spikes can also invalidate patterns that appeared well defined. Technical patterns therefore can fail even when the formation looks textbook-perfect on a chart. Leverage can amplify losses during such swings.
Subjectivity and Historical Data Limitations
Chart interpretation varies between analysts because timeframe selection, indicator settings, and pattern recognition all involve judgment. Historical backtesting adds further limitations, including overfitting to past data, transaction costs, and changing market conditions. A set of trading strategies that appears consistent in historical samples may behave differently when exchange liquidity, participants, or regulation change.
Technical Analysis vs. Price Prediction
Technical analysis describes historical behavior and possible market scenarios; it does not establish future prices with certainty. Indicators and chart patterns are therefore not guarantees of performance, and different analysts can reach opposing conclusions from identical data, and any set of trading decisions carries the possibility that losses exceed initial expectations.
Frequently Asked Questions About Crypto Technical Analysis
What Is Crypto Technical Analysis?
Crypto technical analysis is the evaluation of past prices, trading volume, chart patterns, and indicators to describe cryptocurrency market behavior. Analysts study these inputs to classify trends, price areas, and momentum. The approach describes past and present market conditions and does not establish future prices, which remain uncertain in volatile cryptocurrency markets.
Which Technical Indicators Are Most Commonly Used in Crypto?
Commonly discussed indicators include moving averages, RSI, MACD, Bollinger Bands, and Average True Range. Each indicator measures a different aspect of market behavior, such as trend direction, momentum, or price variability. No single indicator is universally reliable, and readings can conflict, which is why analysts typically compare several tools alongside chart structure.
What Is the Difference Between Price Action and Technical Analysis?
Price action focuses directly on price movements and chart structure, such as swing highs, swing lows, and candle formations. Technical analysis is a broader category that also includes indicators, volume analysis, and statistical tools. In simple terms, price action is one method within technical analysis, though many analysts blend both approaches.
Can Technical Analysis Predict Cryptocurrency Prices?
Technical analysis can help describe trends and historical patterns, but it cannot reliably determine future cryptocurrency prices. Changing market conditions, liquidity shifts, and unexpected events such as regulatory news can override chart signals. Some analysts treat chart findings as scenarios with uncertain outcomes rather than forecasts, and losses may exceed initial expectations.
Why Do Technical Indicators Give False Signals?
Technical indicators give false signals because their calculations rely on past prices, which creates lag, and because sideways markets, sudden volatility, and limited liquidity can distort readings. An RSI reading may remain extreme during a strong trend, for example. Changing market conditions can also make previously useful indicator settings less informative.
Is Technical Analysis Suitable for Every Cryptocurrency?
Technical analysis is generally considered more informative for cryptocurrencies with deep liquidity and long trading history, such as Bitcoin, than for smaller digital assets. Thin market depth, limited history, and extreme price swings reduce the reliability of chart-based information, and a single large order can distort a chart for newly listed tokens.