Crypto Fundamental Analysis: Networks, Adoption, Supply, and Market Drivers

Crypto fundamental analysis is the study of publicly available information about a blockchain network, its usage, its token supply, and the surrounding market context. Analysts use that information to describe how a crypto asset works and what may shape interest in it. The term often appears early for newcomers to crypto trading.
This article covers four pillars: networks, adoption, supply, and market drivers. Each pillar is explained through concepts, metrics, and documented limitations in plain language. The article is educational commentary describing how analysts discuss digital assets. It does not offer guidance for investment decisions, trading instructions, or predictions about price outcomes.
Key Takeaways
- Network activity: examines blockchain usage through on-chain data such as transactions, active addresses, and fees.
- Adoption signals: looks at retention, real-world use cases, integrations, and community engagement.
- Supply mechanics: reviews circulating supply, emission schedules, token unlocks, and burns.
- Market context: considers liquidity, macroeconomic conditions, regulation, and sentiment. The framework is descriptive and non-predictive.
- Active addresses: the count of unique wallet addresses that transact within a period.
- Emission schedule: the programmed pace at which new tokens are issued.
- Fully diluted valuation (FDV): the value of a token’s maximum supply at the current price.
- Regulatory developments and market sentiment: legal changes affecting crypto assets, and the aggregate mood of market participants.
Crypto Fundamental Analysis: Definition and Scope
Fundamental analysis in crypto is a methodology that tries to describe what a digital asset is, how it is used, and what shapes its supply. Evidence comes from blockchain records, project documents, and market data. The approach differs from other analytical schools by focusing on underlying characteristics instead of price chart behavior.
What Fundamental Analysis Means for Digital Assets
Intrinsic value is an analytical idea describing what an asset may be worth based on underlying characteristics, independent of its current price. In equities, analysts estimate the value of an asset from earnings, cash flows, and balance sheets. Many tokens lack such cash flows, so no single accepted valuation model has emerged for crypto assets.
Disclosure practices and holder rights also differ. Listed companies publish audited financial statements under securities rules, and shareholders hold legal claims on profits and assets. Many tokens rely on voluntary documentation such as a whitepaper, and token holders may receive governance rights or protocol utility rather than a claim on earnings.
The European Supervisory Authorities, which include ESMA, stated in a 2022 consumer warning that many crypto-assets are highly risky and speculative and typically fall outside existing EU investor protections. Statements of this kind help explain why information quality receives close attention when investing in cryptocurrencies is discussed. Analysts who perform fundamental analysis therefore examine documentation carefully.
Fundamental Analysis vs Technical Analysis
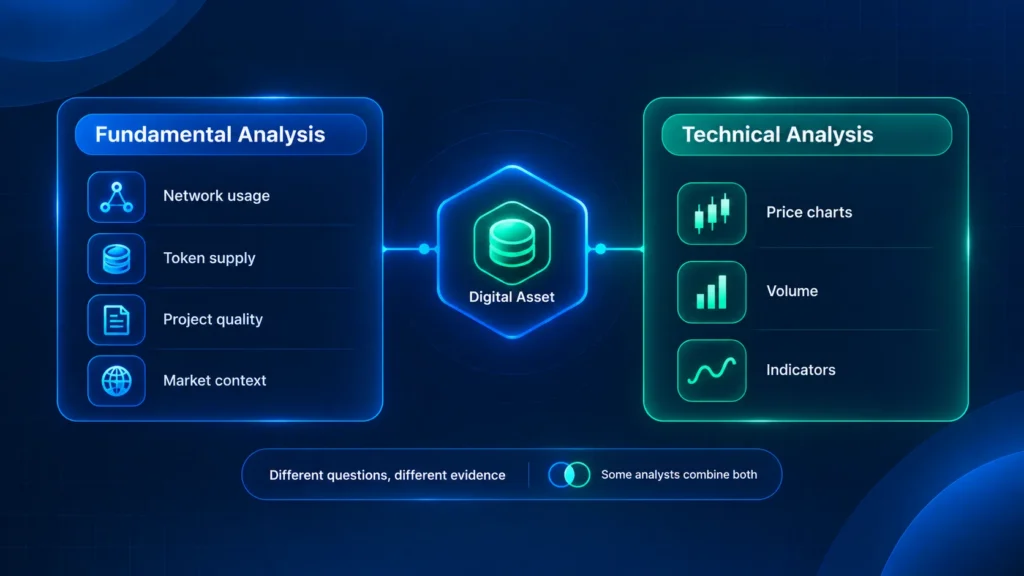
Fundamental analysis examines network usage, token supply, and project quality, while technical analysis studies price and volume patterns on charts. The two schools ask different questions: one concerns what an asset is, and the other concerns how its price has behaved. Neither approach is presented here as superior to the other.
| Aspect | Fundamental analysis | Technical analysis |
| Main question | What does the network do, and how is supply structured? | How have price and volume behaved? |
| Typical evidence | On-chain data, whitepapers, tokenomics, regulation | Price charts and patterns, volume, indicators such as the relative strength index |
| Time orientation | Often discussed over longer horizons | Often discussed over shorter horizons |
| Common limitation | Data inconsistency and no accepted valuation model | Price patterns are interpretive and may not repeat |
Some analysts combine fundamental and technical analysis, using network data for background and chart behavior for context. Fundamental analysis does not supply trading rules, and technical trading approaches carry their own limitations. Readers interested in how methodologies are described in practice can explore crypto trading strategies at a general level.
Asset-Specific Differences: Stablecoins, Tokenized Assets, and Commodity-Like Coins
Not every crypto asset fits one analytical framework. Stablecoins, tokenized assets, and commodity-like coins each raise different questions, and analysts typically adapt the lens accordingly. The descriptions below are general and may not apply to every jurisdiction or every individual project.
- Stablecoins: may be examined through reserve composition, audit disclosures, and redemption mechanics, because the value of a stablecoin depends on how its peg is maintained.
- Tokenized assets: represent claims on off-chain items such as bonds or property, which adds legal structure and counterparty exposure to the analysis.
- Commodity-like coins: such as Bitcoin are often discussed through scarcity narratives, including a fixed maximum supply of 21 million units, rather than through earnings.
- Non-fungible tokens (NFTs): represent unique items and generally lack a standard valuation approach.
Network Metrics: Measuring Blockchain Health
On-chain data is the evidence base most distinctive to crypto, because blockchain ledgers publicly record transactions, balances, and protocol activity. Each metric functions as a performance indicator for one part of a network. Newcomers who analyze crypto this way find that every metric carries documented limitations, so analysts typically read several together.
Active Addresses and Transaction Volume
Active addresses count the unique wallet addresses that send or receive transactions in a given period, while transaction volume measures the number or value of transfers recorded on the blockchain. Growth in both is commonly interpreted as rising network usage, and decline as falling usage. Interpretation remains tentative, because activity can change for many reasons.
An address is not the same as a user. One person can control many wallets, and bots or sybil activity, where one actor creates many identities, can inflate address counts. For example, 10,000 active addresses might represent far fewer individuals, which is why analysts treat the figure as an approximation.
Hash Rate, Staking Participation, and Network Security
Hash rate measures the total computing power securing a proof-of-work blockchain such as Bitcoin, whose consensus design the Bitcoin whitepaper describes. On proof-of-stake chains such as Ethereum, staking participation is the share of supply that validators lock, a mechanism covered in the Ethereum proof-of-stake documentation. Both are participation signals.
Participation alone does not establish decentralization or security. Analysts study mining pool concentration in proof-of-work networks and validator concentration in proof-of-stake networks as risk factors, because a small group controlling a large share could affect network behavior. A high hash rate therefore describes effort expended, not how widely control is distributed.
Fees, Protocol Revenue, and Total Value Locked
Network fees are payments users make to transact, so they are often cited as evidence of paid usage rather than subsidized activity. They also represent the cost of using a network. Fees, protocol revenue, and total value locked (TVL) are separate concepts that are sometimes confused.
- Fees: the total amounts users pay for transactions or services on a network.
- Protocol revenue: the share of fees kept by a protocol or distributed to token holders, rather than paid to validators or liquidity providers.
- TVL: the value of assets deposited in a decentralized finance (DeFi) protocol.
TVL does not independently establish trust, adoption, or revenue. For example, if a protocol holds 1,000 ETH and the ETH price rises 20 percent, TVL in dollar terms rises 20 percent although no new users arrived. Incentive programs can also attract deposits temporarily, so analysts often compare TVL with fees and user counts.
Adoption Indicators and Real-World Usage
Adoption asks whether a crypto asset is actually used, as distinct from whether it is traded or promoted. Trading volume and social media attention can rise without genuine usage. This section frames adoption around separating sustained activity from short-lived spikes, with examples of signals analysts commonly describe and the limitations attached to each.
User Growth, Retention, and Real-World Use Cases
Retention measures the share of users who return after a first interaction, while a one-off spike reflects a burst of activity that fades. Speculation-driven activity, such as rapid token swaps during a price rally, differs from utility-driven activity, such as recurring payments. Sustained retention is generally regarded as stronger evidence of use than headline user counts.
A use case describes a specific job a network performs. Examples include remittance payments settled with stablecoins, merchants accepting a digital currency, and applications built on smart contract networks. Such usage may remain a small portion of overall activity, and data on off-chain usage is often incomplete, so figures are generally regarded as indicative.
Partnerships, Integrations, and Institutional Interest
Ecosystem expansion signals include integrations with payment providers, listings on a crypto exchange, and investment products offered to institutional investors. These developments can widen access through traditional financial channels. Such milestones describe availability and attention, not necessarily demand from users who transact on the network itself.
Listings, partnerships, and institutional vehicles are analytically distinct from demonstrated on-chain usage. A partnership announcement may involve no transaction flow, and an investment product may track price without increasing network activity. Analysts therefore tend to separate announced ecosystem growth from measurable usage when describing a project’s value proposition.
Community Engagement and Ecosystem Expansion
Qualitative signals include community activity, the developer ecosystem, and the number of applications built on a network. Examples are active discussion forums, open-source contributors, and DeFi protocols or NFT marketplaces deployed on a blockchain. These signals are interpretive rather than objective, because social metrics can be inflated by automated accounts or coordinated promotion.
A large community can coexist with little real usage, and a small community can support a functioning network. Meme-driven assets such as Dogecoin illustrate how community attention can shape discussion of an asset alongside, or apart from, technical development. Analysts accordingly treat engagement as context that supplements quantitative data rather than replacing it.
Token Supply and Tokenomics
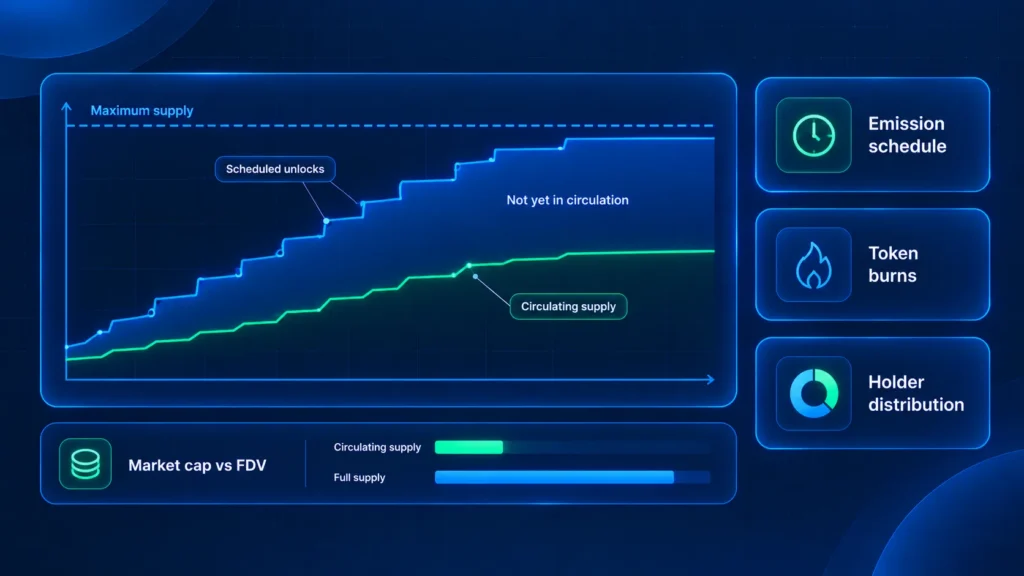
Tokenomics describes the design of token supply, distribution, and incentives. Supply structure is a central theme in crypto analysis because the number of tokens, the pace of issuance, and the allocation among holders can influence supply and demand dynamics. Cross-asset comparisons require care, since projects define supply terms and publish data differently.
Supply Figures, Market Capitalization, and Valuation Ratios
Three supply figures appear in most data sources. Market capitalization and fully diluted valuation (FDV) are calculated from those figures and are often compared side by side. The gap between the two is frequently discussed because the difference indicates how many tokens have yet to enter circulation.
| Term | Definition | Common calculation or example |
| Circulating supply | Tokens currently available in the market | Reported by the project or a data provider |
| Total supply | Tokens created, minus those burned, including locked tokens | Reported by the project or a data provider |
| Maximum supply | Hard cap on tokens that can ever exist, where one exists | Bitcoin: 21 million; Dogecoin has no fixed cap |
| Market cap | Value of circulating supply | Price x Circulating Supply |
| FDV | Value of maximum supply | Price x Maximum Supply |
A large gap between market capitalization and FDV may indicate that many tokens remain locked or unissued, which analysts sometimes describe as potential future dilution. Where no maximum supply exists, FDV may not be calculable. Figures also vary by data provider, so the same asset can show different values.
Some analysts have used valuation ratios to evaluate networks. NVT compares network value with transaction volume, MVRV compares market value with the average price at which coins last moved, and market-cap-to-TVL compares a protocol’s market value with its deposited assets. These ratios feed discussion of whether a network is overvalued or undervalued, where a market may overvalue or undervalue an asset against some reference. Each depends on definitions that vary, and historical relationships may not repeat.
Emission Schedules, Inflation, and Token Burns
An emission schedule sets how quickly new tokens are issued, which determines the inflation rate of supply. Vesting-driven growth adds supply when previously locked allocations become tradable. Bitcoin halvings are a historical example of programmed change: roughly every four years, or 210,000 blocks, the block reward is cut in half.
Token burns permanently remove tokens from circulation. Ethereum has burned part of its transaction fees since 2021, but burns operate alongside issuance, so net supply can still rise or fall depending on activity. A burn does not necessarily produce net deflation or higher value, and analysts generally examine issuance and burns together.
Distribution, Unlocks, and Holder Concentration
Distribution describes how tokens are allocated among founders, investors, treasuries, and the public. Vesting schedules release locked allocations over time, and unlock events occur when large tranches become tradable. Publicly available unlock calendars show when additional supply may enter the cryptocurrency market, though market effects vary.
Holder concentration refers to the share of supply controlled by a small number of wallets, often called whales. Concentrated supply is commonly described in the literature as a risk consideration, because large holders can influence liquidity and price movements. Exchange, custodian, and contract wallets can distort such figures, so concentration data is read with care.
Token Utility and Value Capture
Token utility describes what a token does within its network. Common sources include gas fees paid for transactions, governance rights over protocol decisions, and staking to help secure the network. In simple terms, a token resembles an access pass whose usefulness depends on the service behind it.
Value capture asks whether a token accrues the value its protocol generates, for example through fee sharing or burns. Some protocols generate substantial activity while the token has little connection to that revenue. The question is a recognized analytical topic in tokenomics, discussed to understand design rather than as a criterion to act on.
Market Drivers Shaping Crypto Prices
Market context refers to external conditions that affect crypto assets independently of their individual fundamentals. Liquidity, macroeconomic conditions, sentiment, and regulation can all influence price movements across many tokens at once. The sections below describe these drivers non-directionally, since effects on any specific asset are uncertain and often debated among analysts.
Liquidity, Trading Volume, and Exchange Flows
Market liquidity describes how easily an asset can trade without moving its price. Order book depth, trading volume, and the number of available venues all contribute. Liquidity can differ across crypto trading pairs, since the same token may have deeper markets against one quote currency than another.
Exchange balances and whale wallet movements are observable on-chain. Some analysts interpret inflows to exchanges as potential selling pressure and outflows as holding behavior, but such readings are contested, because transfers may reflect custody changes or internal reshuffling. Flow data is therefore treated as context rather than a directional indicator.
Reported figures also differ in scope. Trading on a cryptocurrency exchange such as Bybit is matched off-chain, so exchange trading volume and on-chain transfers measure different activities. Aggregators vary in which venues and derivatives markets, including futures trading, they include, so volume totals can differ.
Macroeconomic Conditions, Market Cycles, and Narratives
Interest rate environments and liquidity conditions in traditional financial markets are commonly discussed in relation to crypto markets. Some analysts observe that periods of easier financial conditions have coincided with stronger risk appetite, and tighter conditions with weaker appetite. Such correlations have shifted over time and do not establish causation.
Four-year cycle theories link Bitcoin halvings to repeating boom-and-bust phases. These are contested interpretations rather than dependable patterns, because the number of completed cycles is small and market structure has changed considerably. Past performance does not guarantee future results, and any historical pattern may not recur.
Market sentiment is often summarized through sentiment indices that combine survey, volatility, and social data. Narrative rotation describes attention shifting between themes such as DeFi, NFTs, or layer-1 networks. Both are descriptive measures of mood and attention, and neither establishes fundamental value for any asset.
Regulatory Developments and Legal Clarity
Regulatory shifts have historically been associated with episodes of volatility in the cryptocurrency market, as new rules can change access, product availability, and perceived legal clarity. One milestone is the EU Markets in Crypto-Assets Regulation, which, according to the European Supervisory Authorities, has applied to certain crypto-asset types since December 2024.
Another milestone was the approval by the U.S. Securities and Exchange Commission of spot Bitcoin exchange-traded products in January 2024. Such events are described here as historical reference points only. Their effects on any given asset varied, and this article makes no forward-looking claim about future rules or market reactions.
Project Quality, Governance, and Analytical Limitations
Qualitative evaluation examines the people, documents, and structures behind a project, complementing quantitative metrics. This section describes how documentation, governance, and competitive position are commonly reviewed. It closes the analytical discussion with a balanced account of what fundamental analysis cannot do, including data limitations and the absence of predictive certainty.
Whitepaper, Roadmap, and Team Background
A whitepaper is a document describing a project’s purpose, technology, and token design, and the Bitcoin whitepaper of 2008 is the best-known example. Analysts reviewing crypto projects examine whether claims are specific, whether the roadmap, which lays out planned milestones, has been delivered, and whether the team’s track record is verifiable. Such review involves judgment.
Developer activity, often measured by code commits on public repositories, is another reference point. Commit counts are an imperfect proxy for development quality, since a single contributor can inflate counts with minor changes while meaningful work may sit in a few commits.
Governance, Security Audits, and Competitive Position
On-chain governance gives token holders voting rights over protocol changes, though voting power often follows token ownership and may concentrate among large holders. Security audits are independent reviews of smart contract code. Audits can reduce but do not eliminate vulnerability risk, and incidents have affected audited protocols.
Competitive position describes where a project sits within a sector, such as among layer-1 chains or DeFi lending protocols. Comparisons among cryptocurrency projects may cover users, fees, developer activity, and technical design. Competitive positioning is presented as context rather than ranking, because sector leadership changes over time and metrics are not standardized.
Limitations of Fundamental Analysis
Fundamental analysis offers a structured way to describe crypto assets, but the framework has clear boundaries. A balanced account notes both what the approach can illustrate and what it cannot establish, particularly because public blockchain data can be incomplete, manipulated, or interpreted inconsistently.
- Potential advantages: places usage, supply, and project quality in one descriptive framework, relies on public blockchain records, and helps separate marketing claims from observable activity.
- Metric manipulation: bots, sybil addresses, and incentive farming can inflate usage figures.
- Wash trading: repeated self-trades can inflate trading volume without genuine demand.
- Data inconsistencies: analytics providers define metrics differently, so figures for the same asset may diverge.
Data provenance matters. Block explorers, analytics dashboards, and exchange reports derive figures from different sources and methodologies, so active addresses, TVL, or circulating supply for one asset can differ between tools. Analysts commonly note which provider and definition sit behind a number, which supports transparency but cannot remove inconsistency.
Fundamental analysis is a descriptive framework that cannot guarantee outcomes. Prices of volatile and speculative assets may move independently of underlying metrics, and losses may exceed initial expectations in leveraged products. General reading on crypto trading risk management describes how such risk is discussed in the wider market.
FAQ
The questions below summarize the main ideas for readers who prefer short answers. Each response is brief and descriptive, and none constitutes advice. Further detail, examples, and limitations for each topic appear in the sections above, and readers may wish to consult independent, licensed sources for personal circumstances.
What Is Crypto Fundamental Analysis?
Crypto fundamental analysis is the study of network activity, adoption, token supply, and market context to describe a digital asset. It contrasts with technical analysis, which studies price and volume patterns instead of underlying characteristics. The approach is analytical rather than predictive, so it describes what is observable and does not forecast outcomes.
What Can On-Chain Metrics Reveal About Adoption?
Active addresses, transaction volume, fees, and TVL are commonly cited as adoption evidence. Addresses are not the same as users, and TVL is not the same as revenue, since TVL can rise with token price alone. Metrics inform the adoption question but do not settle it.
How Does Token Supply Influence Long-Term Value?
Supply structure, unlock schedules, and burns are discussed in relation to scarcity and dilution. A capped supply may be described as scarce, while large scheduled unlocks may be described as dilutive. Supply is one factor among many, and demand, utility, and market conditions also matter.
Can Fundamental Analysis Predict Crypto Prices?
No. Fundamentals alone cannot establish reliable future prices or guarantee forecasting accuracy. Markets respond to macroeconomic conditions, sentiment, regulation, and events that do not appear in network data. Fundamental analysis describes an asset, and it does not indicate future price movements or whether to buy or sell.
How Do Market Drivers Differ from Network Fundamentals?
Market drivers are external conditions such as macroeconomic policy, regulation, and sentiment, while network fundamentals are asset-specific, such as usage, supply, and project quality. For example, an interest rate change is a market driver, while a rise in active addresses is a network fundamental. The two can move independently.