Best Indicator for Crypto Trading: Moving Averages, RSI, MACD, and ATR

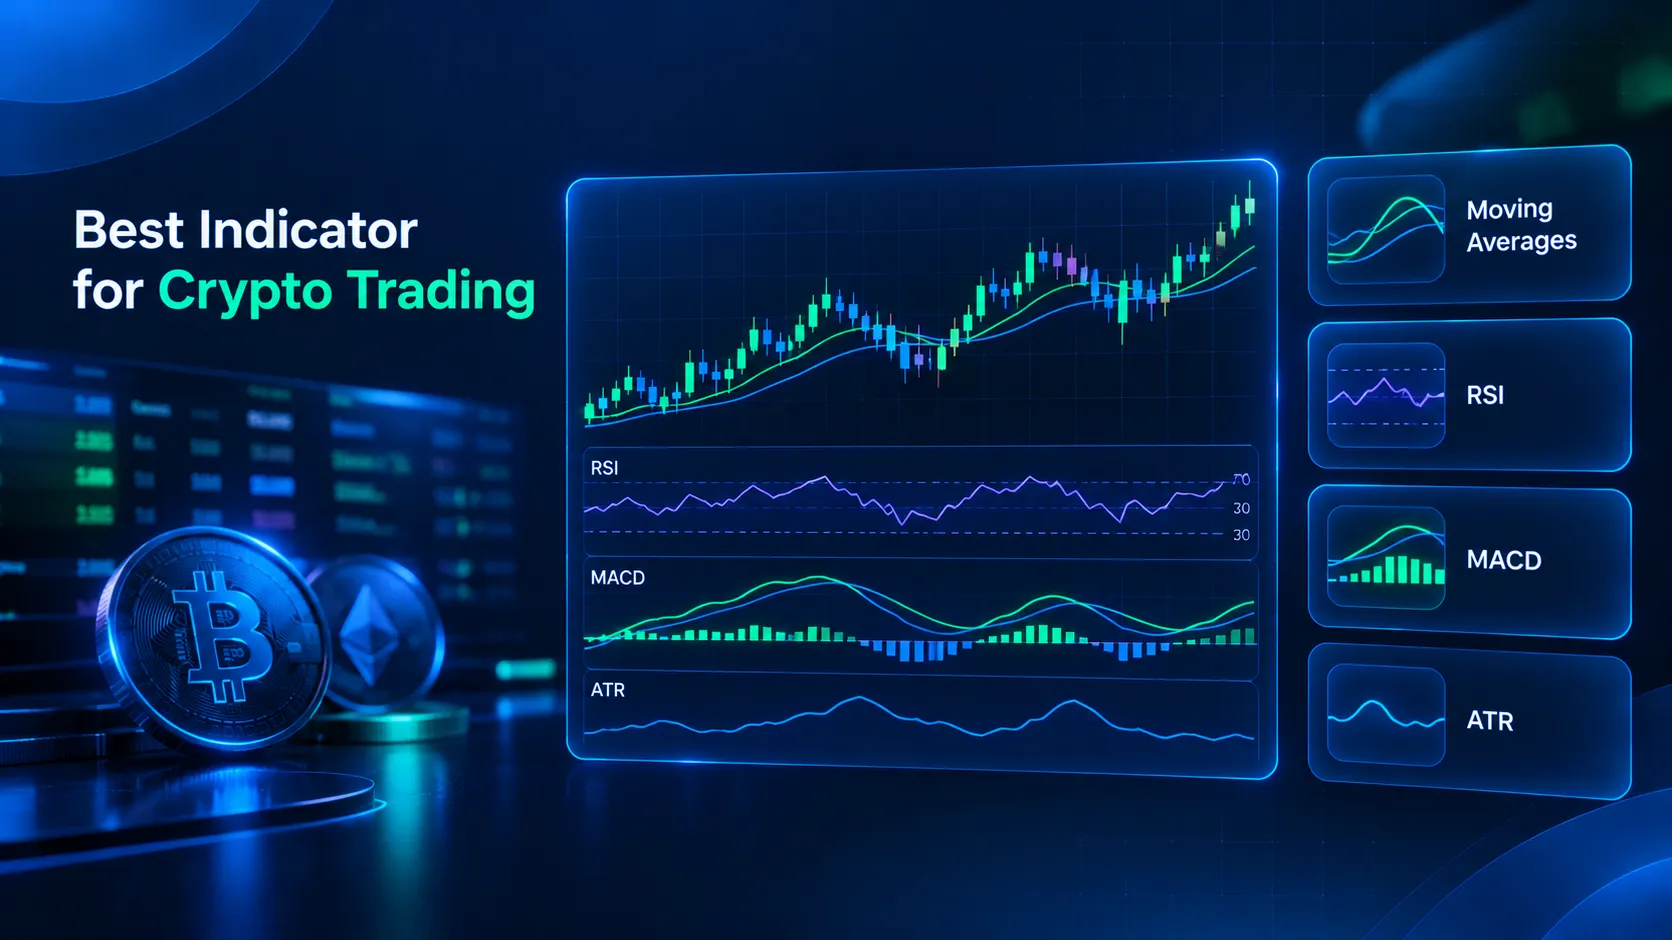
A technical indicator is a mathematical calculation based on price or volume data, and technical indicators are widely used in crypto trading to study cryptocurrency price behavior. Moving averages, the Relative Strength Index (RSI), Moving Average Convergence Divergence (MACD), and Average True Range (ATR) are four frequently cited tools on platforms such as TradingView.
Market participants generally treat the choice of the best indicator for crypto trading as context-dependent, because each tool answers a different analytical question about trend, momentum, or volatility. No single indicator is presented here as universally superior, and the article describes each tool at a conceptual level for educational purposes only.
Key Takeaways
- Moving averages are associated with trend direction by smoothing historical price data.
- RSI is associated with momentum, measuring the speed and magnitude of price changes on a 0-100 scale.
- MACD is associated with the combination of trend and momentum, using relationships between two exponential moving averages.
- ATR is associated with volatility, measuring the typical size of price movement rather than its direction.
- All four indicators are derived from historical price data, and none is designed to predict future prices.
- Cryptocurrency market volatility can affect how indicator readings are interpreted.
What Are Crypto Trading Indicators?
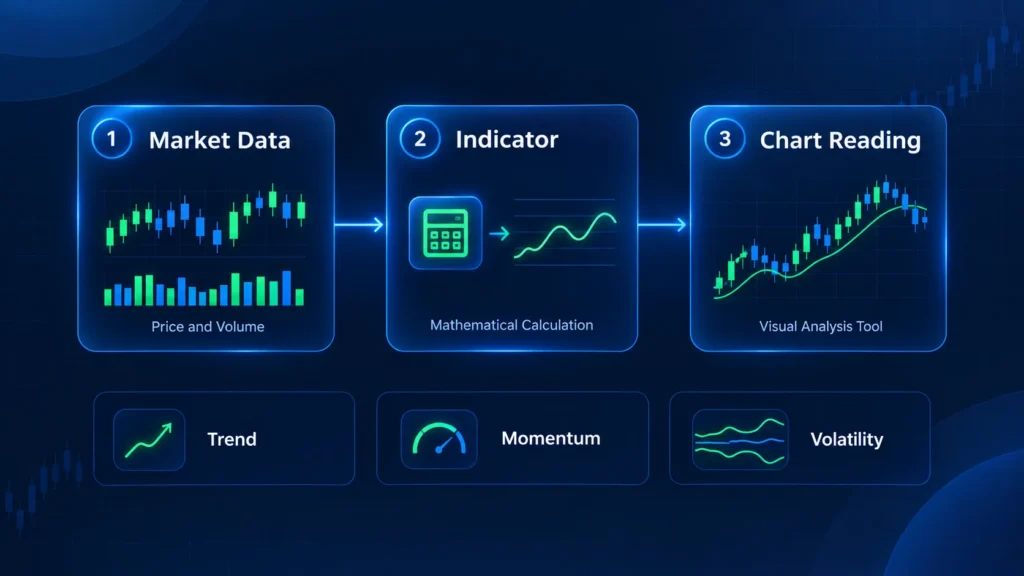
Crypto indicators are analysis tools that convert raw market data into lines, bands, or histograms displayed on a chart. Within crypto technical analysis, indicators summarize historical price and volume behavior of assets such as Bitcoin. This section provides conceptual background rather than instruction.
Technical analysis is the study of historical price and trading volume data to describe market behavior, rather than the study of a project’s financial statements. A trading indicator applies a formula to that data, producing values that can be displayed in TradingView or on a cryptocurrency exchange such as Binance. Indicators are therefore descriptive analytics, not forecasting machines.
Cryptocurrency exchanges record each trade of a coin, and blockchain technology publishes on-chain data about wallet activity. Supply and demand, investor sentiment, and market liquidity shape the resulting price data. Composite metrics such as the CBBI (Colin Talks Crypto Bitcoin Bull Run Index) also combine several data inputs into a single reading.
Trend, Momentum, and Volatility
Indicators are commonly grouped into three categories according to the question each attempts to answer. The grouping helps beginners understand why different tools can display different readings at the same moment, since each metric measures a different characteristic of price movement. The assignments below are general descriptions and are non-operational.
- Trend: moving averages attempt to describe the general direction price has been moving.
- Momentum: RSI attempts to describe how fast and how strongly price has been changing, and MACD is often described as combining trend and momentum.
- Volatility: ATR attempts to describe how large price swings have typically been.
Other categories and tools exist. Bollinger Bands are commonly described as volatility indicators, the Aroon indicator as a trend-following indicator, and volume indicators examine trading volume. Fibonacci retracement is another analysis tool often discussed alongside them. This article concentrates on four widely referenced tools to keep the explanation focused.
Leading and Lagging Characteristics
Lagging indicators reflect past price action, which means readings typically confirm movements after they have started. Moving averages and MACD are conventionally placed in this group. Leading indicators attempt to identify potential turning points earlier, a classification often applied to oscillators such as RSI. These labels are analytical conventions rather than guarantees of timing.
The 24/7 nature of cryptocurrency markets can influence indicator behavior compared with stock or foreign exchange market charts, which pause outside trading sessions. Continuous trading means a daily closing price depends on a time boundary set by each platform. Readings may therefore differ slightly between charting services and exchanges.
Moving Averages: Trend Direction
A moving average is one of the most widely used trend indicators in cryptocurrency analysis. Its core purpose is smoothing price data by averaging the closing price over a chosen number of periods, which filters short-term fluctuations and makes underlying direction easier to observe. StockCharts educational material describes moving averages as trend-following tools based on past prices.
Simple vs Exponential Moving Averages
A simple moving average (SMA) assigns equal weight to every period in its window, while an exponential moving average (EMA) gives greater weight to recent prices. As a result, EMA generally reacts faster to current market changes, whereas SMA produces a smoother but slower line. Neither type is inherently superior.
| Feature | SMA | EMA |
| Weighting | Equal weight for all periods | Greater weight for recent prices |
| Responsiveness | Slower | Generally faster |
| Short-term noise | Less affected | Potentially more affected |
Lookback periods of 20, 50, and 200 are widely observed benchmarks in market commentary, often applied to daily charts. A 20-period average reflects shorter-term behavior, while a 200-period average is commonly associated with long-term trend assessment in assets such as Bitcoin. These values are conventions and are not prescribed settings.
Crossovers, Support, Resistance, and Limitations
The golden cross and the death cross are widely recognized market terms. A golden cross describes a shorter moving average, often the 50-period, rising above a longer one, often the 200-period, while a death cross describes the opposite. Commentators often interpret these events as bullish or bearish context, though outcomes have varied historically.
Moving averages are also sometimes interpreted as dynamic support or resistance zones, meaning areas where price has historically paused or reversed near the line. This interpretation resembles patterns discussed in crypto trading chart patterns, although it remains a visual observation rather than a rule, because price can move through any average.
Moving averages carry limitations. Inherent lag means the line reflects events after they occur, frequent whipsaws can appear in sideways markets when price repeatedly crosses the average, and all values rely on historical data. Cryptocurrency market volatility can amplify these effects, so interpretations are generally described cautiously.
Relative Strength Index: Momentum
The Relative Strength Index (RSI) is a momentum oscillator and one of the most commonly cited indicators in cryptocurrency analysis. Developed by J. Welles Wilder and introduced in 1978, RSI evaluates the speed and magnitude of recent price changes on a bounded scale. Wikipedia’s RSI entry summarizes its history and construction.
RSI Scale and Overbought or Oversold Readings
RSI is expressed on a 0 to 100 scale, with readings above 70 conventionally described as overbought and readings below 30 as oversold. The standard 14-period setting is a common default on TradingView and other charting platforms. Oversold conditions in this sense describe stretched selling pressure, not a verdict on value.
Extreme readings describe current conditions and do not, by themselves, indicate that a reversal is imminent. Strong trends can keep RSI at extremes for extended periods, so an overbought reading in a rising market may persist. The StockCharts RSI guide discusses this behavior in trending conditions.
RSI Divergence and Limitations
Divergence describes a situation where price movement and the indicator move in different directions, for example price reaching a higher high while RSI forms a lower high. Some analysts interpret this pattern as a sign of weakening momentum. It is presented here as an analytical observation, not a signal or instruction.
RSI has limitations. The indicator can remain at extremes during strong trends, the 70 and 30 thresholds are conventions rather than rules, and short-term volatility in crypto markets can produce conflicting readings across timeframes. Market sentiment, including fear of missing out, can also keep momentum elevated longer than historical averages might suggest.
MACD: Trend and Momentum
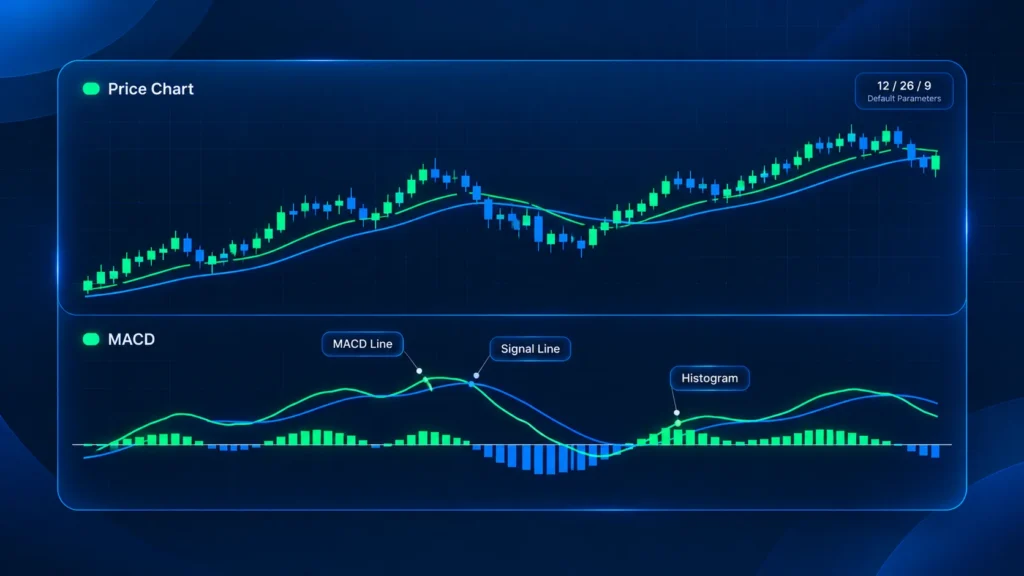
Moving Average Convergence Divergence (MACD) is a trend-following momentum indicator that reflects the relationship between two moving averages. MACD is often described as combining elements of trend and momentum analysis in a single tool. The StockCharts MACD overview credits Gerald Appel with its creation.
MACD Line, Signal Line, and Histogram
MACD displays three conceptual components on a chart, each describing a different relationship between price averages. The conventional parameters of 12, 26, and 9 periods are standard defaults used by many platforms, not recommendations. The list below describes each component in general terms.
- MACD line: derived from the difference between a 12-period and a 26-period exponential moving average.
- Signal line: a 9-period moving average of the MACD line.
- Histogram: a visual representation of the distance between the MACD line and the signal line.
MACD Crossovers and Limitations
Interactions between the MACD line and the signal line, as well as movements relative to the zero line, are commonly described in market commentary as potential reflections of momentum shifts. The histogram offers a visual sense of whether momentum is strengthening or weakening, since the bars expand or contract with the distance between the two lines.
MACD limitations include being a lagging tool, because the indicator is built from moving averages. MACD is also unbounded, so no universal overbought or oversold levels exist, and the indicator is often described as less informative in sideways markets. Whale activity or sudden news can produce sharp readings that fade quickly.
Average True Range: Volatility
Average True Range (ATR) is a volatility indicator developed by J. Welles Wilder and published in his 1978 book New Concepts in Technical Trading Systems. ATR measures the typical size of price movement over a given period rather than its direction, which distinguishes ATR from moving averages, RSI, and MACD. Wikipedia’s ATR entry documents this background.
True Range and ATR Calculation Concepts
True range is the largest of three distances, a design that lets the measure capture price gaps between periods. In cryptocurrency charts, gaps are less frequent than in stock charts because trading is continuous, though sharp jumps still occur. The three distances are listed below conceptually.
- The current high-low range.
- The gap between the current high and the previous close.
- The gap between the current low and the previous close.
ATR is then described as a smoothed average of these true range values, commonly over 14 periods. The smoothing reduces the effect of any single unusually large period. This explanation remains conceptual, and the indicator calculates a rolling measure of typical movement rather than a forecast of future movement.
ATR Readings and Limitations
Rising ATR values are generally associated with expanding volatility, while falling values suggest contracting volatility. ATR is expressed in price units and is unbounded, so its absolute value depends on the asset. A reading for Bitcoin and a reading for a low-priced coin therefore cannot be compared directly.
ATR has a general association with volatility assessment and risk-related analysis, where market participants sometimes discuss it as a way to gauge the typical range of price swings. This is described informationally and does not constitute guidance on stop-loss placement or position sizing. Risk remains specific to each person’s circumstances.
The main limitation is that ATR says nothing about price direction. A high reading can occur during a rapid rally or a sharp decline, and the indicator displays the same positive value in both cases. Market liquidity can also influence readings, because thin order books can widen price ranges.
Crypto Indicator Comparisons and Limitations
The four indicators serve complementary analytical functions rather than competing for a single best designation. Comparing them side by side clarifies why each answers a different question about market behavior. The table below summarizes category, primary function, and main limitation for each tool, based on the preceding sections.
| Indicator | Category | Primary Function | Main Limitation |
| Moving averages | Trend | Smooth price data to show direction | Lag and whipsaws in sideways markets |
| RSI | Momentum | Measure speed and magnitude of price changes on a 0-100 scale | Can stay at extremes during strong trends |
| MACD | Trend and momentum | Reflect the relationship between two EMAs | Lagging and unbounded, with no fixed levels |
| ATR | Volatility | Measure typical size of price movement | Provides no directional information |
RSI vs MACD and Complementary Indicator Roles
RSI is bounded between 0 and 100 and is often characterized as reacting earlier to momentum changes, while MACD is unbounded and often described as a confirmation-oriented tool. Because the two calculations differ, RSI and MACD can present different impressions of the same price chart, which is a normal feature of momentum indicators.
Market participants commonly discuss combining indicators from different categories, such as trend, momentum, and volatility, to obtain a more complete picture of market conditions. Combining indicators in this way is a commonly described analytical practice, not a recommended setup. Similar descriptions appear in discussions of crypto trading strategies, where indicators are one component among many.
Market Conditions, Indicator Overload, and Prediction Limits
Indicator effectiveness is often described as regime-dependent. Trend tools such as moving averages are typically discussed as more informative in trending markets, while oscillators such as RSI are often discussed in the context of range-bound markets. In sideways conditions, trend tools can produce repeated conflicting readings.
Indicator overload is a widely discussed problem. Stacking many tools that measure similar things, such as several momentum oscillators, adds redundancy rather than clarity, since each reading derives from the same price data. Multiple indicators from different categories are generally described as offering broader context than several indicators from one category.
All indicators are based on historical data, and none can guarantee outcomes. Past performance does not guarantee future results, and losses may exceed initial expectations, particularly with leveraged products such as CFDs. Any investment, whether in a cryptocurrency, a stock, or a foreign exchange market position, can reduce money held in a portfolio. Cautious interpretation is generally emphasized.
FAQ
Which Crypto Trading Indicator Is Best?
No single indicator is universally considered best, since each answers a different analytical question about trend, momentum, or volatility. The choice is typically described as context-dependent.
How Do SMA and EMA Differ?
SMA weights all periods equally, while EMA emphasizes recent prices. EMA is generally more responsive to current price changes, though it can also be more prone to reacting to short-term noise.
Does ATR Indicate Price Direction?
No. ATR measures only the magnitude of price movement and volatility, not the direction of the market.
Can Crypto Indicators Predict Prices?
Indicators are derived from historical price data and summarize past behavior, so they are analytical tools rather than forecasting mechanisms. Outcomes remain uncertain, and research on any asset typically draws on more than a single indicator.