Best Time Frame for Crypto Trading: Choosing Chart Intervals for Each Strategy

Chart intervals shape how cryptocurrency price data appears on screen, which is why the best time frame for crypto trading is a frequent question among beginners approaching crypto trading. Each interval compresses market activity into candlesticks of a fixed length, so a 1-minute view and a weekly view display the same market in very different ways.
No single interval is universally best. Its relevance depends on trading style, holding period, market conditions, and analytical objectives. This article describes seven common intervals: 1-minute, 5-minute, 15-minute, 1-hour, 4-hour, daily, and weekly. Each is outlined with its characteristics and limitations in an educational context, without investment advice.
Key Takeaways
- Chart timeframes determine how much price activity each candlestick represents.
- Lower intervals reveal short-term fluctuations but may contain more market noise.
- Higher intervals present broader price movements while reducing intraday detail.
- Scalping, day trading, swing trading, and position trading are commonly associated with different intervals.
- Multi-timeframe analysis provides complementary perspectives on market behaviour.
- Cryptocurrency volatility, trading costs, and continuous market activity can affect how intervals are interpreted.
What Is a Time Frame in Crypto Trading?
A time frame, also called a chart interval, defines the period that each candlestick represents on a price graph. In technical analysis, the selected interval changes how price data is presented, while the underlying activity on a crypto exchange remains the same. Understanding this distinction is a foundation for reading any price display.
How Crypto Chart Timeframes Work
Each candlestick records four values for its period: open, high, low, and close, known as OHLC. A 5-minute candle summarises five minutes of price activity for cryptocurrencies like Bitcoin, a 1-hour candle summarises sixty minutes, and a daily candle summarises twenty-four hours. Twelve 5-minute candles combine into one 1-hour candle, showing how longer intervals aggregate shorter ones.
Lower Timeframes vs Higher Timeframes
Lower timeframes, such as 1-minute or 5-minute charts, display brief price fluctuations in fine detail but often include more market noise. Higher timeframes, such as daily or weekly charts, consolidate activity into broader movements and show market context. The trade-off between granular detail and broader perspective is a central theme when comparing intervals.
Why Timeframes Matter in Cryptocurrency Markets
The crypto market operates around the clock, 7 days a week, including weekends, unlike stock market sessions that close each day. Because participants can buy and sell on a crypto exchange at any hour, volatility, liquidity, and blockchain-based price feeds can alter how candles appear. Platforms such as Coinbase and Binance may display slightly different pricing for the same asset.
Best Crypto Trading Timeframes for Different Trading Styles
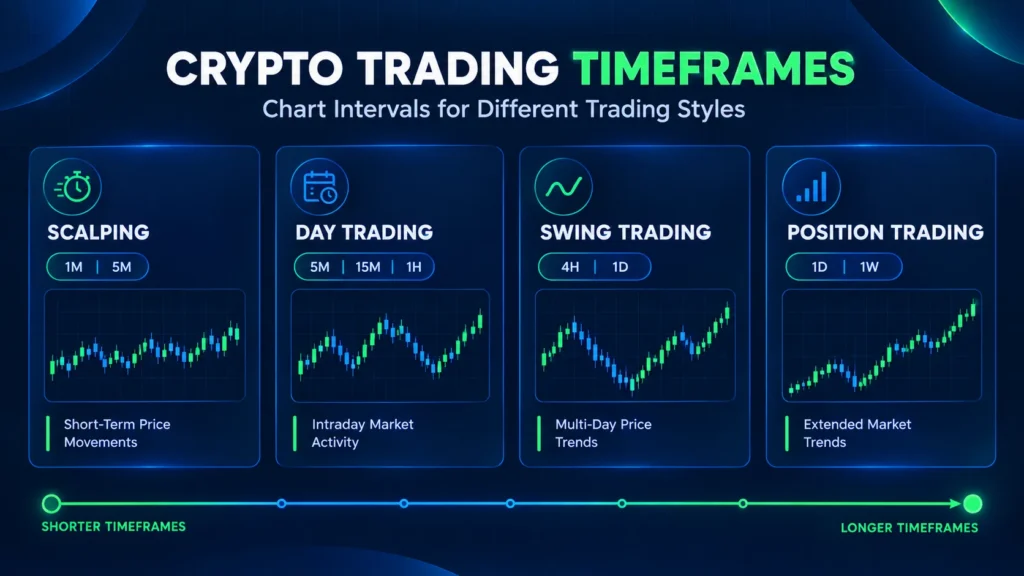
Descriptions of common crypto trading strategies often link each style with a particular interval, because each style observes the market over a different horizon. The table summarises these associations descriptively. It does not identify the best time to trade, and no interval is presented as optimal for every trader or financial market.
| Trading Style | Commonly Associated Intervals | Typical Holding Period | Analytical Focus |
| Scalping | 1-minute, 5-minute | Seconds to minutes | Very short-lived price movements |
| Day trading | 5-minute, 15-minute, 1-hour | Within one trading day | Intraday trends |
| Swing trading | 4-hour, daily | Several days to weeks | Intermediate market trends |
| Position trading | Daily, weekly | Weeks to months or longer | Long-term market trends |
Scalping: 1-Minute and 5-Minute Charts
Scalping focuses on very short-lived price movements, and 1-minute and 5-minute intervals are commonly associated with this style. These views provide a high level of detail and frequent fluctuations. Scalping is also described as sensitive to transaction costs and as requiring sustained attention, since each small market move is observed as it develops.
Day Trading: 5-Minute, 15-Minute, and 1-Hour Charts
Day trading examines intraday price movements, generally within a single trading day. A 5-minute chart presents fine detail, a 15-minute view smooths some short-term fluctuations, and a 1-hour view consolidates activity into hourly patterns. Trading volume often varies by time of the day, which can change how clearly intraday trends appear.
Swing Trading: 4-Hour and Daily Charts
Swing trading focuses on price movements that may extend over several days or weeks. The 4-hour and daily charts are commonly associated with this approach because they present intermediate-term trends while placing less emphasis on short-lived fluctuations. Swing traders typically observe fewer candles per day, which reduces visual noise compared with intraday intervals.
Position Trading: Daily and Weekly Charts
Position trading focuses on broader market movements over extended periods, often months or longer. Daily and weekly charts present long-term trends, significant price changes, and historical context. Because each candle summarises a full day or week, short-term fluctuations are largely compressed, and the resulting view emphasises direction over timing.
Crypto Chart Timeframes Compared: 1m, 5m, 15m, 1H, 4H, 1D, and 1W
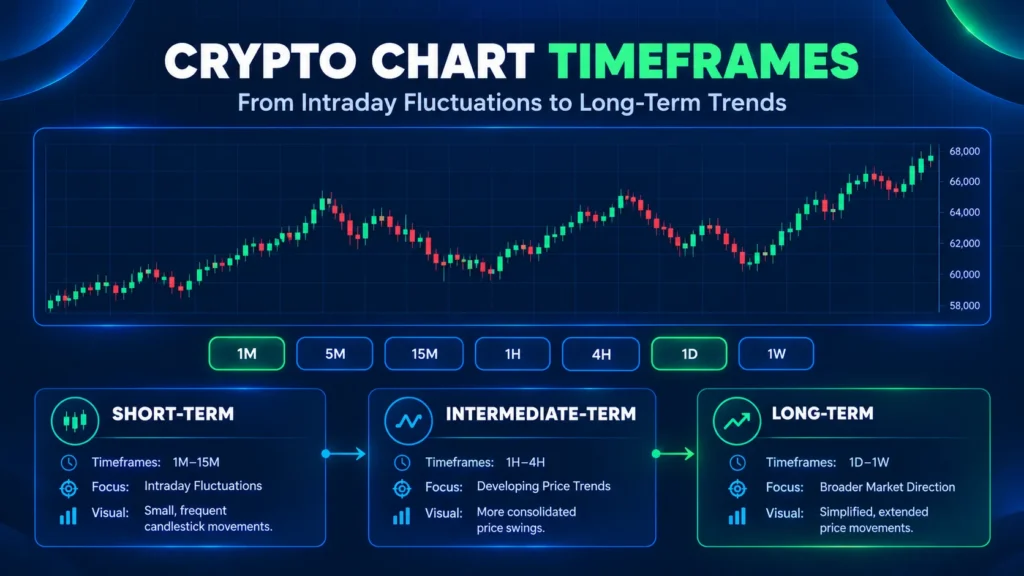
The seven most common cryptocurrency intervals differ in what each candle summarises, which analytical uses are associated with them, and where limitations appear. The table provides a side-by-side overview, and the sections that follow describe each group in more detail for beginners who trade cryptocurrencies or are exploring how markets are structured.
| Interval | Each Candle Covers | Typical Analytical Use | Main Limitation |
| 1-minute | 1 minute | Observing rapid price changes | High visual noise |
| 5-minute | 5 minutes | Short-term intraday movements | Sensitive to brief spikes |
| 15-minute | 15 minutes | Shorter intraday movements | Limited broader context |
| 1-hour | 60 minutes | Hourly intraday patterns | Less fine detail |
| 4-hour | 4 hours | Intermediate price movements | Slower reflection of sudden changes |
| Daily | 24 hours | Market direction | Limited intraday detail |
| Weekly | 7 days | Long-term trends and cycles | Limited short-term visibility |
1-Minute and 5-Minute Charts
One-minute and five-minute charts display rapid price changes and short-term volatility in considerable detail. They are relevant to intraday observation, particularly when trading volume is high around the market open of major sessions. Limitations include visual noise and sensitivity to brief price movements, which may reflect a single large order rather than a lasting change in direction.
15-Minute and 1-Hour Charts
A 15-minute chart captures shorter intraday movements, while a 1-hour chart consolidates activity into broader hourly patterns. Both provide more context than 1-minute candles, with fewer candles and less visual noise. The difference between the two reflects a balance between price detail and a wider view of the trading day.
4-Hour and Daily Charts
A 4-hour chart presents intermediate price movements across six candles per day, while a daily chart offers a wider view of market direction. Both are relevant for analysing trends that develop beyond individual intraday fluctuations. Daily candles also align with a full 24-hour cycle of cryptocurrency activity.
Weekly Charts
Weekly candles summarise seven days of price activity in a single bar. These charts are used to examine long-term trends, historical price levels, and broader market cycles in assets like Bitcoin. Their limitation is minimal visibility into short-term changes, since sharp intraday moves may appear only as a wick.
Factors That Influence Crypto Timeframe Selection
The relevance of an interval varies across market participants because analytical goals, practical constraints, and market conditions differ. The following sections cover four considerations: observation horizon, market conditions, time availability, and costs. The discussion is descriptive and does not address decisions to buy or sell for any investor.
Trading Style and Holding Period
The intended observation horizon is closely related to the selected interval. Short-term trading styles are generally associated with shorter charts, whereas approaches focused on broader market movements tend to emphasise longer intervals. A holding period of several weeks, for example, is rarely examined through 1-minute candles because each candle represents a very small portion of the period.
Market Volatility and Liquidity
Sudden price movements, thin order books, and changing trading volume can affect candlestick shapes. Short intervals may display more pronounced fluctuations because a single large order can cause a significant price move when liquidity is limited. Volatility also differs across assets, with smaller tokens often showing sharper candles than Bitcoin in similar conditions.
Time Availability and Market Monitoring
Each interval relates to how frequently new candles appear. A 1-minute view produces sixty new candles per hour, whereas a daily view produces one per day. In forex, market open and close times follow regional sessions, while those who trade crypto face continuous activity, so constant monitoring and periodic review represent distinct approaches.
Trading Fees and Transaction Costs
Exchange fees, bid-ask spreads, and slippage affect the economics of trading across different holding periods. Frequent transactions to buy and sell crypto may make these costs more noticeable relative to small price movements. For instance, a 0.1% fee on each side totals 0.2%, a large share of a 0.5% price change. The example is illustrative only.
Multi-Timeframe Analysis in Crypto Trading
Multi-timeframe analysis examines the same crypto market across several intervals. Combining time horizons can add context, although the limitations of technical analysis remain. The list below outlines common groupings, which are descriptive conventions rather than instructions:
- Higher timeframes (daily, weekly): longer-term direction and market structure.
- Middle timeframes (4-hour, 1-hour): intermediate trends and swings.
- Lower timeframes (15-minute, 5-minute): short-term price detail.
Higher Timeframes for Broader Market Context
Daily and weekly charts display longer-term price direction, major fluctuations, and broader market structure. Their role in multi-timeframe analysis is to contextualise shorter-term activity, for instance by showing whether a recent decline is small relative to a multi-month market trend. This broader view may reduce the emphasis placed on isolated candles.
Lower Timeframes for Short-Term Market Detail
One-hour, 15-minute, and 5-minute intervals reveal movements that may be invisible on daily or weekly charts, such as brief consolidations or sharp reversals. The additional detail can describe how a larger price movement developed. However, lower intervals also carry increased noise, so small fluctuations may appear more significant than they are.
How Different Timeframes Can Present Conflicting Signals
A market may appear to trend upward on a daily chart while showing a decline on a 15-minute chart. These observations often reflect different stages of the same price movement rather than contradictory data. For example, a short pullback within a multi-week rise is visible on the 15-minute view but appears as one small candle on the daily chart.
Limitations of Multi-Timeframe Analysis
Switching between intervals can lead to selective interpretation, where only supportive patterns are noticed. Differences in candle formation, incomplete candles, and market volatility can also influence interpretation. Multiple timeframes do not guarantee accurate forecasts, and the European Supervisory Authorities describe many crypto-assets as highly risky and speculative.
Common Mistakes When Choosing Crypto Chart Timeframes
Several recurring problems are associated with interpreting price movements across intervals. The following descriptions are observational and do not form a prescriptive checklist. Each problem relates to how detail, context, and expectation interact when a participant in the financial market reviews cryptocurrency price data.
Treating Lower Timeframes as More Accurate
Additional chart detail does not automatically improve the reliability of an interpretation. Short-term market noise means that small price fluctuations may have limited significance in a broader context. A 1-minute candle showing a sharp spike, for instance, may represent a single large order, while the 4-hour chart records only a minor movement within a wider range.
Ignoring the Broader Market Trend
Concentrating exclusively on short intervals can obscure longer-term price movements. Intraday market moves describe short-lived activity, whereas broader direction appears on daily and weekly views. A decline of 2% on a 5-minute chart may seem notable, yet a weekly chart could show that the same decline is small compared with previous months.
Switching Timeframes to Confirm Existing Expectations
Confirmation bias describes the tendency to focus on information that supports an existing view. In technical analysis, this can appear as switching to the interval that seems to match an expectation. The same price history can look different at different levels of detail, so selecting one interval selectively may produce an incomplete picture.
Interpreting Incomplete Candles as Final Signals
The open, high, low, and close of an active candle can change until the interval ends. A developing 1-hour candle at the thirty-minute mark may show a long upper wick that disappears when the candle closes. Completed candles contain final values, so reading developing candles as final information can lead to different interpretations.
How Timeframes Affect Technical Indicators and Candlestick Patterns
Chart intervals influence how technical indicators and candlestick patterns appear and are interpreted. Indicators calculate values from a set number of candles, so a change in interval changes the elapsed time behind each reading. Common tools in crypto technical analysis include:
- Moving averages, which smooth closing prices over a set number of candles.
- Momentum indicators such as the Relative Strength Index.
- Candlestick patterns, which describe shapes formed by consecutive candles.
Moving Averages Across Different Timeframes
A moving average summarises closing prices over a selected number of candles. A 50-period moving average covers fifty candles, which equals about 12.5 hours on a 15-minute chart, roughly 8 days on a 4-hour chart, and 50 days on a daily chart. The same candle count therefore represents very different elapsed periods.
RSI and Momentum Indicators
The Relative Strength Index (RSI) is a momentum indicator that measures the speed and size of recent price changes over a defined data window, commonly fourteen candles. Readings and patterns may differ between shorter and longer intervals because each window covers a different span of time. A reading on a 5-minute chart describes roughly seventy minutes of activity.
Candlestick Patterns and Chart Context
Candlestick formations can appear differently depending on the interval. A pattern on a 5-minute chart represents a few minutes of market activity, whereas a similar formation on a daily chart represents full days. Neither guarantees a particular outcome. Further descriptions of formations appear in material on crypto trading chart patterns.
Conclusion: No Universal Best Timeframe for Crypto Trading
Chart intervals, trading styles, market conditions, and analytical objectives are closely connected. Shorter intervals present detail, longer intervals present context, and multi-timeframe analysis combines both with its own limitations. No interval consistently provides the best interpretation across all cryptocurrencies and market environments, so the best time frame for crypto trading remains dependent on circumstances.
Risk disclosures relevant to this topic are summarised below. A further warning from European supervisory authorities notes that crypto-assets can be risky and that legal protection may be limited.
- Past performance does not guarantee future results.
- Losses may exceed initial expectations, particularly with leveraged CFDs.
- Total loss of invested money is possible with crypto-assets.
- This article is educational and does not constitute investment advice.
Frequently Asked Questions (FAQ)
The questions below address common points of confusion about time intervals that are not covered in detail above. Answers are brief, descriptive, and intended for general education rather than personal guidance.
What Is the Best Timeframe for Crypto Trading?
No timeframe is universally best. Relevance varies according to trading style, holding period, market conditions, and analytical goals. The same reasoning applies to the best time to trade crypto, since activity depends on the time of the day and trading volume. Each interval has limitations, so no single choice suits every purpose.
Which Timeframe Is Commonly Used for Crypto Scalping?
Scalping is commonly associated with 1-minute or 5-minute charts. These intervals show rapid price fluctuations in detail, which is why close monitoring is typically described as part of the style. Transaction costs are also noticeable at this scale, since small price movements may be comparable in size to fees and spreads.
Is a 15-Minute or 1-Hour Chart Better for Crypto Day Trading?
Neither is inherently better, because each presents a different level of detail. A 15-minute chart shows shorter intraday movements, whereas a 1-hour chart consolidates price activity into broader hourly patterns. Day traders sometimes compare both, and the preferred view often depends on the volatility and liquidity of the specific asset.
Are 4-Hour Charts Suitable for Crypto Swing Trading?
Four-hour charts are commonly associated with swing trading because they present intermediate-term price movements with less short-term noise. Daily intervals can add context for broader trends. Suitability remains subjective, since swing trading outcomes depend on market conditions, and no interval removes the risk of losses.
What Is the Difference Between a 1-Day and a 1-Week Crypto Chart?
A daily candle represents one day of price activity, while a weekly candle consolidates seven days into a single bar. Daily intervals retain more detail about short-term movements, whereas weekly intervals emphasise long-term direction. Weekly candles may therefore hide sharp daily swings that remain visible on a daily view.
Can Different Crypto Timeframes Show Different Trends?
Yes, shorter and longer intervals can display different price directions because they represent different periods of market activity. A 15-minute decline may sit inside a rising daily trend. These differences do not necessarily indicate a data error, although exchange-specific price feeds can occasionally cause small variations.
Why Do Crypto Candlestick Patterns Change Across Timeframes?
Aggregating shorter candles into longer candles changes the visible bodies, wicks, and patterns. Several 5-minute candles with distinct shapes may merge into one 1-hour candle with a different appearance. A formation on one interval may therefore not appear on another, and no formation guarantees a particular outcome.